
Grow Your Business
An electrician earning the median wage in Oregon takes home $48.71 an hour, while the median electrician in Arkansas earns $23.59, according to the Bureau of Labor Statistics Occupational Employment and Wage Statistics survey for May 2025. That $25.12 gap means the same service call costs an Oregon shop more than twice as much to staff. This page collects electrician labor rates in one place: BLS wages for all 50 states and DC, the burden that sits on top of every paid hour, what homeowners are actually charged, and a worked formula that turns a wage into a billable rate. Whether you quote from electrical contractor software or a spreadsheet, every price you set sits on top of these numbers.
How much are electrician labor rates in 2026?
Electrician labor rates in 2026 run from $50 to $130 an hour for most residential work, with a $100 to $200 service call fee that usually covers the first hour, according to HomeGuide's electrician cost guide updated in February 2026. Those are billed rates, the price a customer sees on the invoice. The wage behind them is much lower: the national median electrician earned $30.38 an hour in May 2025, per BLS. The difference between the two numbers pays for payroll taxes, insurance, the truck, the office, drive time, unbillable callbacks and profit. A shop billing $100 for a technician it pays $30.38 is not keeping $69.62 an hour. Rates also climb with license level and urgency, so a master electrician on a Saturday emergency can bill several times what an apprentice does on a scheduled Tuesday install.
| Rate type | Typical billed rate per hour |
|---|---|
| Apprentice electrician (supervised) | $40 to $70 |
| Journeyman electrician | $50 to $100 |
| Master electrician | $90 to $130+ |
| Commercial electrician | $100 to $130 |
| Emergency (nights, weekends, holidays) | $150 to $200 |
Source: HomeGuide, Electrician Cost Per Hour, February 2026.
Service call fees and trip charges
HomeGuide reports two common structures: a $100 to $200 service call that includes the first hour, or a separate $40 to $100 trip fee charged on top of labor. The first undercharges jobs that run 20 minutes over. The second protects drive time but looks worse next to competitors who advertise "no trip charge."
Whichever you pick, put it on every invoice as its own line so a technician never waives it at the door. Building the fee into a saved line item in your electrical contractor invoicing software makes it the default rather than a negotiation.
Takeaway: decide whether your trip charge is credited to labor, then make it automatic on every ticket.

Electrician labor rates by state: the 2026 wage table
Electrician labor rates by state start with what electricians are paid, and the table below lists May 2025 BLS estimates for occupation code 47-2111, Electricians. Each row shows how many electricians work in the state, the 10th percentile, median and 90th percentile hourly wage, the loaded cost of a median electrician, and the labor cost of each hour you can actually bill. The spread between the 10th and 90th percentile inside one state is often wider than the gap between neighboring states, so experience matters as much as geography. The loaded column multiplies the median wage by 1.44, the construction benefit ratio explained later. The last column divides that loaded cost by 0.70, assuming seven of every ten paid hours reach an invoice. Use it as a floor before overhead and profit, never as a price.
| State | Electricians employed | 10th percentile hourly | Median hourly | 90th percentile hourly | Loaded median hour | Labor per billable hour |
|---|---|---|---|---|---|---|
| Alabama | 10,900 | $18.09 | $26.78 | $37.61 | $38.56 | $55.09 |
| Alaska | 1,870 | $28.09 | $43.00 | $59.23 | $61.92 | $88.46 |
| Arizona | 21,140 | $21.89 | $29.36 | $43.08 | $42.28 | $60.40 |
| Arkansas | 7,500 | $16.79 | $23.59 | $35.80 | $33.97 | $48.53 |
| California | 73,310 | $22.50 | $36.62 | $67.47 | $52.73 | $75.33 |
| Colorado | 17,010 | $21.88 | $29.92 | $45.27 | $43.08 | $61.54 |
| Connecticut | 7,710 | $22.92 | $37.28 | $50.13 | $53.68 | $76.69 |
| Delaware | 2,260 | $18.40 | $30.63 | $50.64 | $44.11 | $63.01 |
| District of Columbia | 2,440 | $24.97 | $37.97 | $60.48 | $54.68 | $78.11 |
| Florida | 49,700 | $18.36 | $27.52 | $37.10 | $39.63 | $56.61 |
| Georgia | 21,650 | $17.88 | $28.04 | $40.39 | $40.38 | $57.69 |
| Hawaii | 3,070 | $21.99 | $46.38 | $59.90 | $66.79 | $95.41 |
| Idaho | 5,690 | $18.67 | $30.29 | $45.90 | $43.62 | $62.31 |
| Illinois | 23,120 | $23.67 | $47.87 | $59.45 | $68.93 | $98.47 |
| Indiana | 19,020 | $20.76 | $32.93 | $47.75 | $47.42 | $67.74 |
| Iowa | 10,310 | $19.12 | $29.26 | $43.02 | $42.13 | $60.19 |
| Kansas | 6,350 | $20.51 | $31.66 | $46.55 | $45.59 | $65.13 |
| Kentucky | 11,030 | $17.84 | $28.71 | $40.99 | $41.34 | $59.06 |
| Louisiana | 10,550 | $18.63 | $29.59 | $39.33 | $42.61 | $60.87 |
| Maine | 3,780 | $26.05 | $36.24 | $55.63 | $52.19 | $74.56 |
| Maryland | 13,690 | $22.33 | $35.33 | $56.91 | $50.88 | $72.69 |
| Massachusetts | 17,810 | $22.59 | $38.18 | $61.64 | $54.98 | $78.54 |
| Michigan | 23,530 | $20.66 | $36.67 | $49.58 | $52.80 | $75.43 |
| Minnesota | 14,350 | $22.83 | $37.58 | $57.13 | $54.12 | $77.31 |
| Mississippi | 6,610 | $18.36 | $29.26 | $36.80 | $42.13 | $60.19 |
| Missouri | 12,780 | $21.09 | $31.45 | $50.03 | $45.29 | $64.70 |
| Montana | 2,750 | $23.62 | $36.90 | $43.03 | $53.14 | $75.91 |
| Nebraska | 6,440 | $19.42 | $29.24 | $45.21 | $42.11 | $60.16 |
| Nevada | 8,350 | $22.17 | $35.37 | $58.27 | $50.93 | $72.76 |
| New Hampshire | 3,330 | $20.76 | $30.21 | $44.16 | $43.50 | $62.14 |
| New Jersey | 13,520 | $23.35 | $37.14 | $62.91 | $53.48 | $76.40 |
| New Mexico | 5,020 | $17.62 | $28.07 | $41.74 | $40.42 | $57.74 |
| New York | 40,130 | $21.99 | $37.86 | $63.29 | $54.52 | $77.89 |
| North Carolina | 21,640 | $19.29 | $27.31 | $36.09 | $39.33 | $56.19 |
| North Dakota | 3,570 | $22.33 | $31.59 | $48.57 | $45.49 | $64.99 |
| Ohio | 28,950 | $19.59 | $31.11 | $47.73 | $44.80 | $64.00 |
| Oklahoma | 8,500 | $18.22 | $29.33 | $44.59 | $42.24 | $60.34 |
| Oregon | 10,590 | $28.63 | $48.71 | $63.24 | $70.14 | $100.20 |
| Pennsylvania | 22,730 | $21.92 | $32.50 | $58.95 | $46.80 | $66.86 |
| Rhode Island | 2,420 | $20.67 | $35.62 | $49.44 | $51.29 | $73.27 |
| South Carolina | 8,010 | $21.31 | $28.24 | $37.41 | $40.67 | $58.10 |
| South Dakota | 2,980 | $21.31 | $29.51 | $38.49 | $42.49 | $60.70 |
| Tennessee | 17,070 | $19.04 | $29.37 | $44.31 | $42.29 | $60.41 |
| Texas | 76,770 | $18.23 | $28.16 | $38.61 | $40.55 | $57.93 |
| Utah | 11,450 | $19.20 | $29.81 | $42.84 | $42.93 | $61.33 |
| Vermont | 1,270 | $22.82 | $30.49 | $63.50 | $43.91 | $62.73 |
| Virginia | 23,630 | $19.61 | $30.24 | $50.83 | $43.55 | $62.21 |
| Washington | 19,380 | $25.08 | $45.78 | $64.40 | $65.92 | $94.17 |
| West Virginia | 4,290 | $20.97 | $31.16 | $45.74 | $44.87 | $64.10 |
| Wisconsin | 14,310 | $21.55 | $36.80 | $48.93 | $52.99 | $75.70 |
| Wyoming | 2,960 | $23.19 | $36.59 | $50.00 | $52.69 | $75.27 |
| United States | 757,220 | $20.50 | $30.38 | $52.17 | $43.75 | $62.50 |
Source: BLS Occupational Employment and Wage Statistics, May 2025 state estimates for SOC 47-2111 (published 2026). Loaded and billable columns: Bella FSM calculation, 2026, using the 1.44 benefit ratio from BLS Employer Costs for Employee Compensation, June 2026, and an illustrative 70% billable utilization.
BLS counted 757,220 wage and salary electricians in May 2025, with a median of $30.38, a mean of $34.37, and a 90th percentile of $52.17. The mean sits $3.99 above the median because high earners pull the average up. Our guide to how much electricians make covers career pay by license level.
Takeaway: price from your own state's row, and plan offers around the median rather than the mean.
Ready to level up your business?
Try Bella FSM free and transform the way you work.
Highest and lowest paying states for electricians
The top-paying states
Oregon leads at a $48.71 median, followed by Illinois at $47.87, Hawaii at $46.38, Washington at $45.78 and Alaska at $43.00, per BLS OEWS May 2025. All five sit $12.62 to $18.33 above the $30.38 national median. In the top four, the labor cost per billable hour in the table already lands between $94.18 and $100.20 before any overhead.
The lowest-paying states
Arkansas has the lowest median at $23.59, followed by Alabama at $26.78, North Carolina at $27.31, Florida at $27.52 and Georgia at $28.04.
The largest electrician labor markets
Texas employs the most electricians at 76,770, with a $28.16 median. California follows at 73,310 and a $36.62 median, then Florida at 49,700, New York at 40,130 and Ohio at 28,950. Big markets mean more competitors, so response speed starts to beat price. Shops that win there book same-day slots through electrical contractor scheduling software instead of cutting the rate.
Takeaway: if you work near a state line, quote from the higher-wage state's numbers.
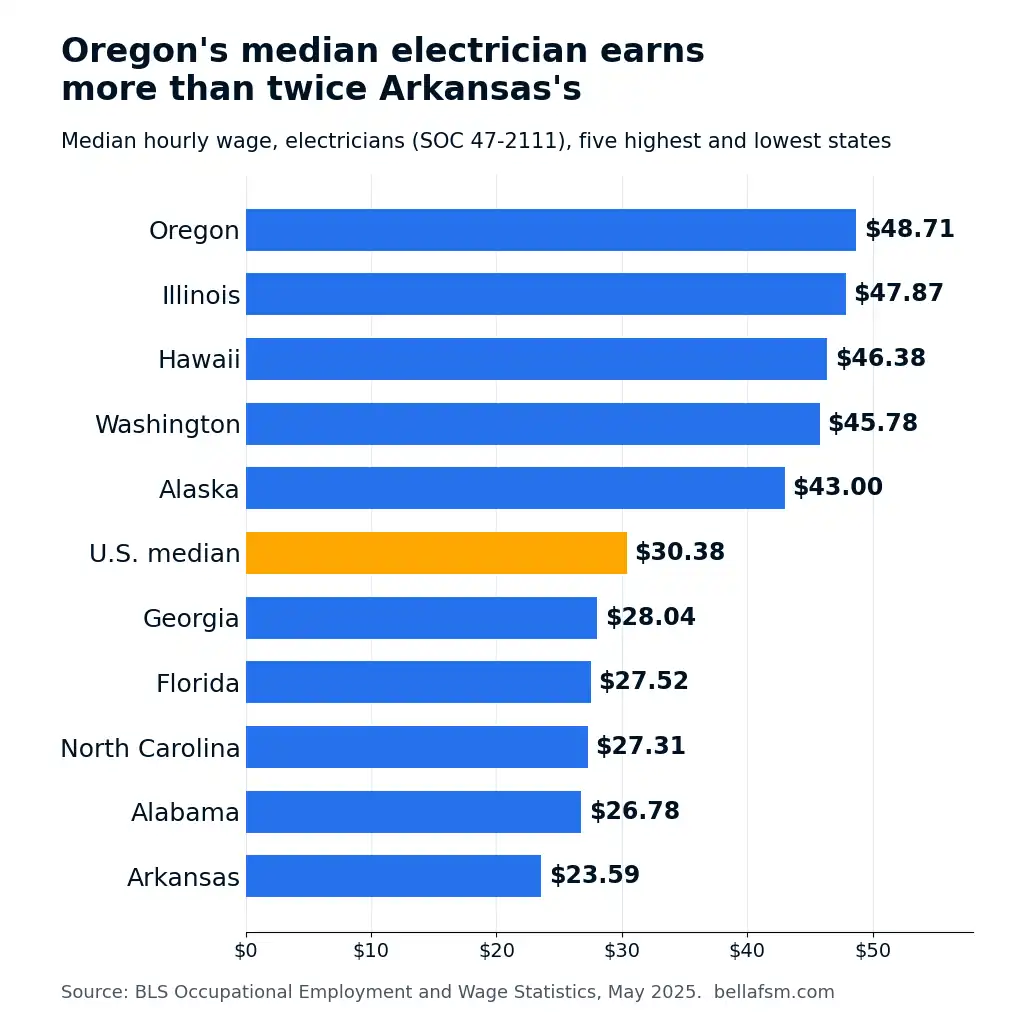
Chart: Median hourly electrician wage, five highest and five lowest states versus the U.S. median. Source: BLS OEWS, May 2025. Chart may be embedded with attribution to Bella FSM and a link to this page.
What does an electrician really cost per hour once burden is added?
A median electrician costs about $43.75 per hour worked once benefits and payroll costs are added, which is the $30.38 BLS median wage multiplied by 1.44. That multiplier comes from the BLS Employer Costs for Employee Compensation release for June 2026, which puts private construction employers at $51.96 in total compensation per hour worked, of which $36.13 is wages and $15.84 is benefits. Benefits make up about 30.5% of the total cost. Legally required benefits alone add $4.42 an hour, and workers' compensation accounts for $1.10 of that. The figure covers all construction occupations rather than electricians alone, and union shops with pension plans usually run higher. Still, 1.44 is a sounder starting point than a rough 1.2 guess, and the gap between the two is about $7.29 per hour on a median wage.
| Cost per hour worked, private construction | June 2026 |
|---|---|
| Wages and salaries | $36.13 |
| Total benefits | $15.84 |
| Legally required benefits (included above) | $4.42 |
| Workers' compensation (included above) | $1.10 |
| Total compensation | $51.96 |
Source: BLS Employer Costs for Employee Compensation, June 2026, private industry construction (released September 2026).
Paid hours that never reach an invoice cost just as much, like the supply house run or a warranty revisit. Capturing real clock-in, travel and on-site time through a mobile field service app shows your true utilization instead of a guess.
Takeaway: multiply wages by 1.44 as a minimum, and replace it with your own payroll ratio once you have a year of data.
Ready to take your business further?
Start using Bella FSM free and work smarter.
How should an electrical contractor turn wages into a billable rate?
An electrical contractor should set a billable rate by dividing the loaded labor cost by billable utilization, adding overhead per billable hour, and then grossing the total up for target profit. In one line: billable rate equals the loaded wage divided by utilization, plus overhead per billable hour, all divided by one minus the target margin. Every input comes from your own books, which is why two shops in the same town can both be right at different prices. The loaded wage comes from payroll and the 1.44 ratio above. Utilization is billable hours divided by paid hours, and it is the input most owners overestimate. Overhead is everything that is not field labor or job materials: trucks, fuel, insurance, office staff, rent, software and marketing. Target margin is the net profit you want left over after all of it.
A worked example at the national median
Take a one-truck technician paid the $30.38 BLS median for 2,080 hours a year. Loaded at 1.44, that hour costs $43.75. At 70% utilization the technician bills 1,456 hours, so each billable hour carries $62.50 of labor. Assume an illustrative $58,240 of annual overhead assigned to that truck, which is $40.00 per billable hour, and a 15% net margin target.
| Billable utilization | Billable hours per year | Labor per billable hour | Overhead per billable hour | Break-even rate | Rate at 15% margin |
|---|---|---|---|---|---|
| 60% | 1,248 | $72.92 | $46.67 | $119.59 | $140.69 |
| 70% | 1,456 | $62.50 | $40.00 | $102.50 | $120.59 |
| 80% | 1,664 | $54.69 | $35.00 | $89.69 | $105.52 |
Source: Bella FSM calculation, 2026. Median wage from BLS OEWS May 2025; 1.44 ratio from BLS ECEC June 2026; overhead, utilization and margin are illustrative inputs.
What the example tells you
At 70% utilization the median-wage technician needs to bill $120.59 an hour to hit a 15% margin. That is near the top of HomeGuide's $50 to $130 consumer range and above its $50 to $100 journeyman band. Shops charging $95 that stay profitable usually beat flat-rate book times, or the owner works unpaid. The same rate also feeds job quotes, where labor units multiply by it before materials and markup, as covered in our guide on how to estimate electrical work.
Utilization moves the answer more than wages. Dropping from 80% to 60% raises the required rate by $35.17 an hour, more than the full wage gap between Texas and Washington. That is why a shop's electrical contractor CRM software matters to pricing: a list of maintenance and panel-inspection customers fills slow weeks with billable work instead of idle time.
Takeaway: rebuild this calculation every January and every time a wage changes, and protect utilization before you cut price.
To run it with your own payroll and overhead, the labor rate calculator walks through each step.
Methodology and sources
Wage, employment and percentile figures come from the BLS Occupational Employment and Wage Statistics program, May 2025 reference period (published 2026), for occupation 47-2111, Electricians, retrieved through the BLS public data API in October 2026. OEWS excludes the self-employed; the BLS Occupational Outlook Handbook, which includes them, puts total electrician jobs at 821,000 in 2025 and projects 9% employment growth from 2025 to 2035, with about 72,700 openings a year.
The 1.44 benefit ratio is total compensation divided by wages and salaries for private industry construction in the BLS Employer Costs for Employee Compensation release for June 2026. Billed rate ranges come from HomeGuide's electrician cost per hour guide, updated February 2026.
Loaded cost, labor per billable hour and the worked rate table are Bella FSM calculations. Utilization, overhead and margin inputs are illustrative. State figures are statewide, and metro wages can differ sharply. Figures are reviewed when BLS publishes the next OEWS release.
Media & citation: data on this page may be cited with attribution to Bella FSM and a link to this page.
Frequently Asked Questions
Set electrician labor rates from your own numbers
The state table tells you what the market pays; your books tell you what to charge. Load your state's median at 1.44, divide by honest utilization, add overhead and margin, and compare the answer with today's rate. If the gap is large, fix utilization first, because every idle hour is still paid at full loaded cost.
Electrician labor rates that come from your own costs hold up when a customer pushes back. To track time, utilization and margin in one place, explore how Bella FSM's software for electricians connects scheduling, invoicing and job costing.
Ready to grow your business?
Try Bella FSM free and simplify your work.