
Grow Your Business
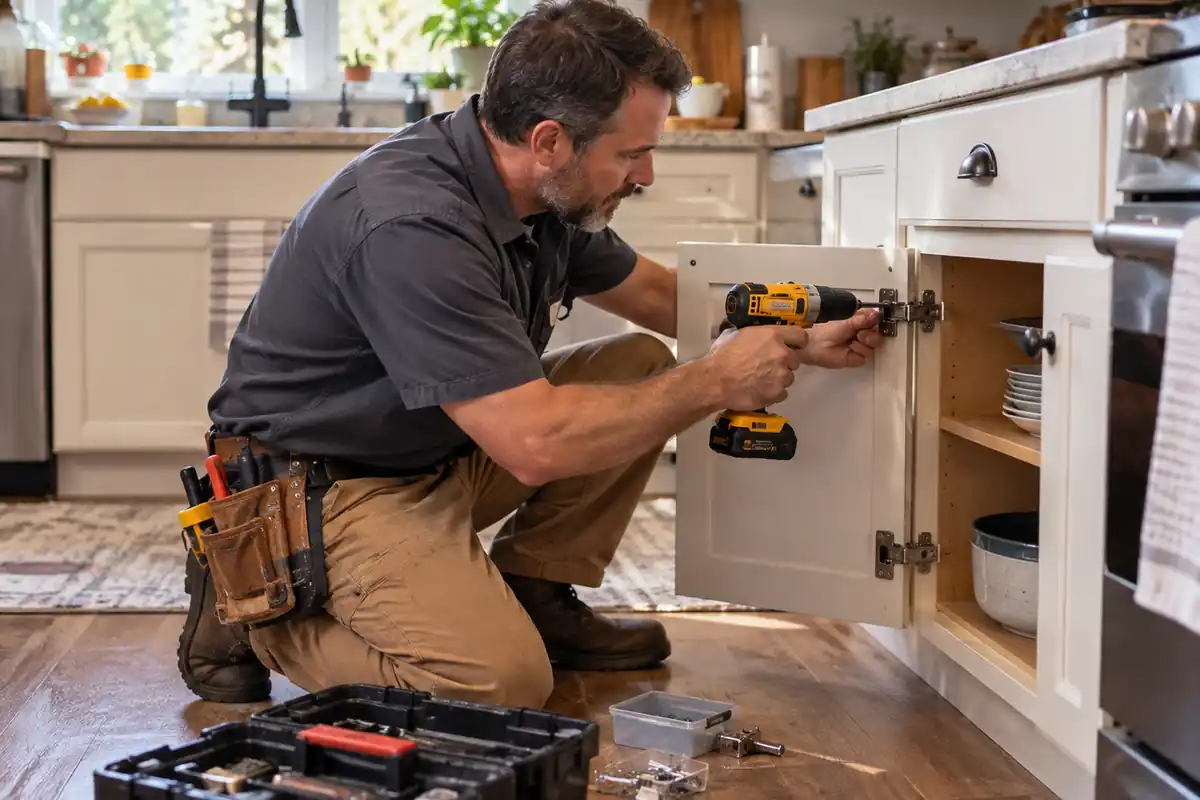
A handyman earning the median wage in Minnesota makes $28.46 an hour, while the median in West Virginia is $18.70, according to the Bureau of Labor Statistics Occupational Employment and Wage Statistics survey for May 2025. That $9.76 gap changes what you can offer a new hire and how low your minimum charge can safely go. This page lists handyman salary by state for all 50 states and the District of Columbia, then carries the wage through payroll burden to the hourly rate a handyman company needs to charge. Whether you book jobs through handyman software or a paper calendar on the dashboard, every quote you write starts with these labor numbers.
What is the average handyman salary in 2026?
The median handyman in the United States earned $23.84 an hour, or $49,590 a year, in May 2025, according to the BLS Occupational Employment and Wage Statistics survey for general maintenance and repair workers (SOC 49-9071). That is the newest federal wage figure available in 2026, and it covers 1,529,700 wage and salary workers. The mean was $25.86, because higher-paid workers in expensive metros pull the average above the middle. When you are hiring, the spread matters more than either number. The bottom 10% earned under $17.00 an hour and the top 10% earned more than $37.11, so a seasoned tech who can handle light plumbing, electrical and carpentry can cost more than twice what a helper costs. One caution applies to every figure here: BLS leaves the self-employed out of this survey, so the one-truck owner-operators who set much of the local price are not counted.
| Handyman wage percentile, U.S. | Hourly wage | Annual wage |
|---|---|---|
| 10th percentile | $17.00 | $35,350 |
| 25th percentile | $19.64 | $40,840 |
| Median | $23.84 | $49,590 |
| Mean | $25.86 | $53,780 |
| 75th percentile | $30.10 | $62,620 |
| 90th percentile | $37.11 | $77,180 |
Source: BLS Occupational Employment and Wage Statistics, May 2025, SOC 49-9071 Maintenance and Repair Workers, General.
Why BLS files handymen under maintenance and repair workers
BLS has no separate handyman occupation. The closest match, 49-9071, covers work that uses the skills of two or more maintenance or craft trades. It also includes apartment, school and hotel maintenance staff, whose steady hours and benefits set the pay floor a handyman company has to beat when it recruits.
Hourly pay versus paid hours
BLS annualizes the hourly wage at 2,080 hours. A handyman who loses a slow January to cancellations takes home less than the annual column suggests.
Filling those gaps is a booking problem. Shops that plan the week in handyman scheduling software can drop a 45-minute faucet swap into the hole a cancellation leaves, and that hour stays paid.
Takeaway: compare job offers on the hourly wage; the annual figure depends on how full you keep the calendar.

Handyman salary by state: the 2026 wage table
Employment and median wages for general maintenance and repair workers in every state and the District of Columbia. Use the hourly column for labor rates and the annual column for job ads.
| State | Employment | Median hourly wage | Median annual wage |
|---|---|---|---|
| Alabama | 16,660 | $20.97 | $43,630 |
| Alaska | 4,590 | $28.97 | $60,270 |
| Arizona | 39,000 | $22.90 | $47,620 |
| Arkansas | 12,410 | $20.87 | $43,400 |
| California | 143,060 | $27.41 | $57,000 |
| Colorado | 22,960 | $24.65 | $51,280 |
| Connecticut | 11,700 | $27.70 | $57,620 |
| Delaware | 3,310 | $24.11 | $50,150 |
| District of Columbia | 4,860 | $29.00 | $60,310 |
| Florida | 111,530 | $22.15 | $46,060 |
| Georgia | 48,430 | $22.92 | $47,680 |
| Hawaii | 8,030 | $27.86 | $57,960 |
| Idaho | 8,200 | $23.17 | $48,190 |
| Illinois | 66,600 | $27.27 | $56,720 |
| Indiana | 34,480 | $23.99 | $49,890 |
| Iowa | 16,500 | $25.08 | $52,160 |
| Kansas | 12,730 | $22.70 | $47,210 |
| Kentucky | 22,190 | $22.50 | $46,810 |
| Louisiana | 21,490 | $21.13 | $43,960 |
| Maine | 5,820 | $23.76 | $49,430 |
| Maryland | 23,730 | $24.76 | $51,490 |
| Massachusetts | 29,830 | $28.04 | $58,320 |
| Michigan | 39,490 | $22.87 | $47,580 |
| Minnesota | 29,660 | $28.46 | $59,200 |
| Mississippi | 14,550 | $21.32 | $44,350 |
| Missouri | 31,180 | $23.26 | $48,370 |
| Montana | 5,420 | $22.54 | $46,870 |
| Nebraska | 9,850 | $24.38 | $50,700 |
| Nevada | 16,520 | $25.17 | $52,360 |
| New Hampshire | 5,780 | $25.40 | $52,830 |
| New Jersey | 37,350 | $26.35 | $54,810 |
| New Mexico | 9,320 | $22.00 | $45,760 |
| New York | 119,650 | $27.79 | $57,790 |
| North Carolina | 43,440 | $23.03 | $47,910 |
| North Dakota | 3,300 | $23.96 | $49,840 |
| Ohio | 64,770 | $25.68 | $53,420 |
| Oklahoma | 18,670 | $20.55 | $42,750 |
| Oregon | 16,160 | $26.13 | $54,350 |
| Pennsylvania | 55,590 | $23.70 | $49,290 |
| Rhode Island | 4,500 | $24.47 | $50,900 |
| South Carolina | 28,020 | $23.02 | $47,880 |
| South Dakota | 3,450 | $23.13 | $48,100 |
| Tennessee | 35,790 | $22.71 | $47,240 |
| Texas | 140,580 | $22.44 | $46,670 |
| Utah | 16,090 | $24.26 | $50,450 |
| Vermont | 2,610 | $26.69 | $55,510 |
| Virginia | 34,540 | $23.79 | $49,470 |
| Washington | 32,450 | $28.44 | $59,160 |
| West Virginia | 8,060 | $18.70 | $38,890 |
| Wisconsin | 30,880 | $26.83 | $55,810 |
| Wyoming | 3,920 | $23.03 | $47,900 |
| United States | 1,529,700 | $23.84 | $49,590 |
Source: BLS Occupational Employment and Wage Statistics, May 2025 state estimates, SOC 49-9071, retrieved October 2026 through the BLS public data API. Employment excludes the self-employed.
Takeaway: use your state's median, not the national figure, in every calculation below.
Ready to level up your business?
Try Bella FSM free and transform the way you work.
Highest and lowest paying states for handymen
The top-paying states
The District of Columbia pays the most at $29.00 an hour, followed by Alaska at $28.97, Minnesota at $28.46, Washington at $28.44 and Massachusetts at $28.04, per BLS. Minnesota is the outlier, paying more than New York ($27.79) and California ($27.41).
The lowest-paying states
West Virginia has the lowest median at $18.70, with Oklahoma at $20.55, Arkansas at $20.87, Alabama at $20.97 and Louisiana at $21.13. West Virginia sits $6.98 below neighboring Ohio, which pays $25.68.
The largest handyman labor markets
California employs 143,060 of these workers, followed by Texas at 140,580, New York at 119,650, Florida at 111,530 and Illinois at 66,600. Texas and Florida together account for more than 252,000 jobs, yet both pay below the national median, at $22.44 and $22.15.
In markets like those, handyman companies compete on price and win on repeat work. Keeping each home's history (what was fixed, what was quoted and declined, which paint color is on the hallway) in handyman crm software turns a one-off TV mount into a list of next jobs.
Takeaway: near a state line, check both medians before you set pay.
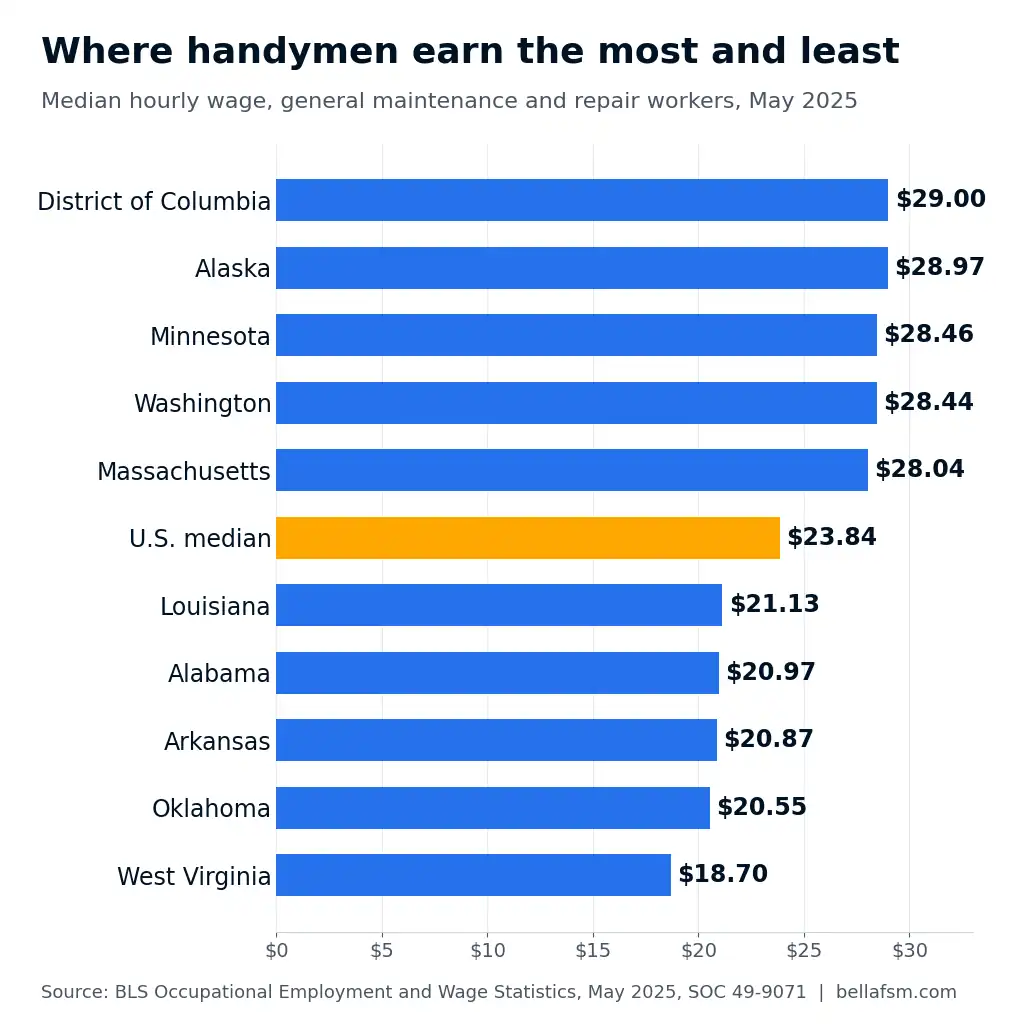
Chart: Median hourly wage for general maintenance and repair workers, five highest and five lowest paying states versus the U.S. median. Source: BLS OEWS, May 2025. Chart may be embedded with attribution to Bella FSM and a link to this page.
What does an employee handyman cost per hour with burden added?
A median-wage handyman costs about $34.81 per hour worked once benefits and payroll costs are added. That is the $23.84 BLS median wage multiplied by 1.46, a ratio taken from the BLS Employer Costs for Employee Compensation release for June 2026. In that release, private employers paid installation, maintenance and repair workers $33.61 an hour in wages and salaries and $49.01 in total compensation, so each wage dollar carried about 46 cents of benefits. The largest pieces were insurance at $4.27, legally required benefits such as Social Security, Medicare, unemployment insurance and workers' compensation at $3.81, and paid leave at $3.29. The ratio is an average for the whole occupational group across private industry, not a handyman-only figure. A small shop with no retirement plan may run lower, and one carrying a high workers' compensation rate for ladder and roof work may run higher.
| Employer cost per hour worked, June 2026 | Cost |
|---|---|
| Wages and salaries | $33.61 |
| Paid leave | $3.29 |
| Supplemental pay | $1.89 |
| Insurance | $4.27 |
| Retirement and savings | $2.15 |
| Legally required benefits | $3.81 |
| Total compensation | $49.01 |
Source: BLS Employer Costs for Employee Compensation, June 2026, private industry, installation, maintenance and repair occupations (released September 2026). Components may not add to the total because of rounding.
To find your own ratio, divide a year of wages plus payroll taxes, comp premiums and benefits by gross wages. The labor rate calculator runs the same math with your numbers.
Takeaway: use 1.46 until you have your own figure, and never price an hour at the wage alone.
How should a handyman business turn wages into a billable rate?
A handyman business should set its hourly rate by working forward from labor cost, not backward from what a competitor charges. Start with the loaded wage, then divide by the share of paid hours that actually get billed, because drive time, supply runs and estimates are paid but not invoiced. Add overhead per billable hour, which covers the truck, insurance, phones, software and the office. The sum is your break-even rate. Divide it by one minus your target net margin to get the rate you should quote. At the national median, a 65% billable share, $60,000 of yearly overhead spread across three techs and a 20% margin, the break-even rate is $68.34 and the target rate is $85.42 an hour. Those overhead, utilization and margin inputs are illustrative. Swap in your own, and the formula still holds.
A worked example at the national median
| Step | Value |
|---|---|
| BLS median hourly wage | $23.84 |
| Burden ratio (BLS ECEC) | 1.46 |
| Loaded cost per paid hour | $34.81 |
| Billable share of paid hours | 65% |
| Labor cost per billable hour | $53.55 |
| Overhead per billable hour ($60,000 over 4,056 hours) | $14.79 |
| Break-even rate | $68.34 |
| Rate at 20% net margin | $85.42 |
Source: Bella FSM calculation using the BLS OEWS May 2025 median wage and the 1.46 ratio from BLS ECEC June 2026; utilization, overhead and margin are illustrative inputs. Formula: rate = ((wage x 1.46 / billable share) + overhead per billable hour) / (1 - margin).
The same math in selected states
Same inputs, different state medians:
| State | Median wage | Loaded cost | Break-even rate | Rate at 20% margin |
|---|---|---|---|---|
| District of Columbia | $29.00 | $42.34 | $79.93 | $99.91 |
| Alaska | $28.97 | $42.30 | $79.87 | $99.84 |
| Minnesota | $28.46 | $41.55 | $78.71 | $98.39 |
| United States | $23.84 | $34.81 | $68.34 | $85.42 |
| Texas | $22.44 | $32.76 | $65.19 | $81.49 |
| Florida | $22.15 | $32.34 | $64.54 | $80.67 |
| West Virginia | $18.70 | $27.30 | $56.79 | $70.99 |
Source: Bella FSM calculation using BLS OEWS May 2025 state medians and the BLS ECEC June 2026 ratio; 65% billable share, $14.79 overhead per billable hour and 20% margin are illustrative inputs.
Checking your rate against the market
Thumbtack's handyman price guide, updated January 2026, puts the national average at $60 to $75 an hour, with low-end rates of $45 to $50 and high-end rates of $100 to $125. An employee-based shop at the national median needs $85.42, above that band.
That is why owner-operators can undercut a company, and why companies lean on trip charges and minimums. A one-hour minimum only protects margin if it lands on the bill. Setting it as a default line item in handyman invoicing software stops techs from waiving it in the driveway.
Flat-rate menus take the hourly number off the table. Our guide to how to price handyman jobs covers the pricing models in detail.
Takeaway: if your target rate beats local prices, fix utilization and minimums before you cut wages.
Ready to take your business further?
Start using Bella FSM free and work smarter.
Using handyman wage data to hire, schedule and bill
Setting pay for a new hire
The BLS 25th percentile, $19.64, is a sensible floor for a supervised helper. The $23.84 median fits a tech who runs jobs alone, and the 75th percentile, $30.10, fits a lead who handles light electrical and plumbing without callbacks.
Raising utilization before raising prices
Handyman days are made of short jobs, so drive time eats utilization. Moving the billable share from 65% to 70% cuts labor cost per billable hour from $53.55 to $49.73 at the national median, a saving of $3.82 on every hour you invoice.
Most of that gain comes from routing. Grouping jobs by neighborhood in handyman dispatch software shrinks the windshield time between a 30-minute repair and the next stop.
Then check the clock against the quote. Logging actual hours against each job in work order management software shows which job types beat the quoted time and which quietly lose money.
Keeping the customers who pay your rate
Repeat customers rarely shop the rate. Sending a seasonal reminder for gutter guards, caulking or smoke detector batteries from a crm for handyman business fills the calendar with customers who accept your price.
Takeaway: pay to your state's market, then protect the rate with tighter routes and repeat customers.
Methodology and sources
Wage figures come from the BLS Occupational Employment and Wage Statistics program, May 2025 estimates, for SOC 49-9071 Maintenance and Repair Workers, General. State and national employment, median hourly wage, median annual wage and percentiles were retrieved in October 2026 through the BLS public data API. These are the most recent OEWS estimates published as of this page's 2026 edition. OEWS surveys employers, so it covers wage and salary workers and excludes the self-employed. The occupation also includes building and facilities maintenance staff, not only residential handymen. The burden ratio of 1.46 is total compensation divided by wages and salaries for private industry installation, maintenance and repair occupations in the BLS Employer Costs for Employee Compensation release for June 2026. Customer price ranges come from Thumbtack's handyman price guide, updated January 2026. Utilization, overhead and margin in the worked examples are illustrative inputs, not survey data. This page is reviewed each year after BLS publishes new OEWS estimates.
Media & citation: data on this page may be cited with attribution to Bella FSM and a link to this page.
Frequently Asked Questions
Use handyman salary by state data to price your next job
Handyman salary by state tells you what the market pays; your books tell you what to charge. Load your state's median at 1.46, divide by an honest billable share, then add overhead and margin.
If the answer beats today's rate, fix utilization first. Tracking hours and trip charges through handyman billing software shows which jobs earn their rate.
Rates built from real costs hold up when a homeowner pushes back. To run scheduling, quotes, invoices and customer history in one place, see how Bella FSM's handyman business software helps handyman companies price every job from real numbers.
Ready to grow your business?
Try Bella FSM free and simplify your work.