
Grow Your Business
Last updated: September 2026. See methodology below.
The average HVAC technician in the United States earns $31.14 per hour, per May 2025 BLS data, while the companies that employ them bill customers $75 to $150 per hour. That gap is not profit; it is where HVAC labor rates live or die. This page collects the wage and rate benchmarks an operator needs to set a billed rate that survives payroll, trucks, insurance, and unbillable hours: national technician wages from the Bureau of Labor Statistics, the highest-paying and largest state markets, what contractors actually charge in 2026, and a worked formula for turning a wage into a rate. Owners who run their numbers inside hvac software can check every figure here against their own jobs, and should.
How much are HVAC labor rates in 2026?
HVAC contractors charge $75 to $150 per hour for standard residential service in 2026, according to HomeGuide's HVAC repair cost guide, with a minimum service call fee of $75 to $200 that typically applies toward the first hour. Emergency work runs $140 to $250 per hour in the same data, and some shops instead add $40 to $80 per hour for after-hours and weekend visits. Those billed rates sit far above the $31.14 mean hourly wage BLS reports for HVAC technicians, and the distance between the two numbers is the whole economics of a service company: payroll taxes, benefits, the truck, the insurance, the office, and every hour a technician spends driving or restocking instead of billing. A shop billing near the bottom of the national band in a top-ten wage state is usually underwater on labor before the first part is marked up.
Where a company lands inside that $75 to $150 band has less to do with courage than with capacity. A calendar that keeps technicians on tight routes with few gaps supports a higher effective rate than a scattered one, which is why operators watch utilization inside hvac scheduling software as closely as they watch the rate card itself.
Service call fees and minimums
The service call fee is the most quoted number on this page for a reason. HomeGuide puts the standard range at $75 to $200, and notes most companies credit it against the first hour of labor. A diagnostic visit runs the same $75 to $200. Fees below that range subsidize drive time; fees above it need a strong brand or an emergency to justify.
HVAC technician wages: the national baseline
Every rate calculation starts with what the technician costs, and the federal wage survey is the cleanest baseline available. BLS Occupational Employment and Wage Statistics for May 2025 counts 409,670 HVAC technicians employed nationally, with a mean hourly wage of $31.14 and a mean annual wage of $64,780. The median sits at $29.33 per hour, or $61,010 per year. The spread matters as much as the middle: the 10th percentile earns $19.25 per hour while the 90th earns $45.78, which means a senior installer can legitimately cost a company more than twice what a junior tech does. Demand is not letting up either; BLS projects employment for the occupation to grow 11% from 2025 to 2035, about 48,200 additional jobs, which is much faster than the average occupation and keeps steady upward pressure on every number in the table below.
| Percentile | Hourly wage | Annual wage |
|---|---|---|
| 10th | $19.25 | $40,050 |
| 25th | $23.25 | $48,360 |
| 50th (median) | $29.33 | $61,010 |
| 75th | $37.05 | $77,060 |
| 90th | $45.78 | $95,210 |
Source: HVAC technician wage percentiles, United States. BLS Occupational Employment and Wage Statistics, May 2025, occupation 49-9021.
Treat the percentile table as a hiring gauge, not trivia. If your lead installer is paid at the 75th percentile but your rate card was built on the median, the payroll line will quietly eat the margin. The cleanest fix is comparing actual wages from your payroll against invoiced labor, which is exactly the report a quickbooks integration makes routine.
HVAC technician pay in the highest-paying states
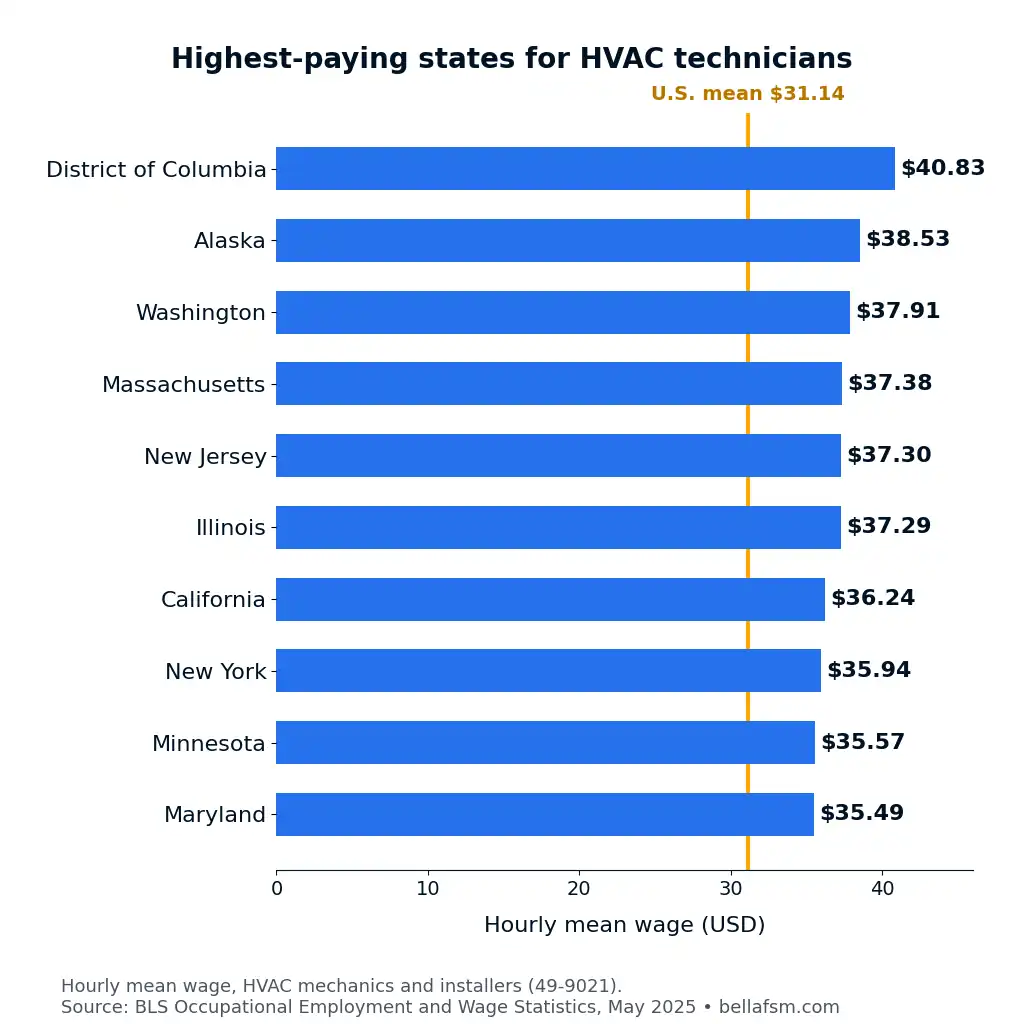
State wage differences are large enough to change the right billed rate by $20 an hour or more. The table lists the fifteen highest-paying states for HVAC technicians by mean hourly wage, including the District of Columbia, from the May 2025 BLS data.
| Rank | State | Hourly mean wage |
|---|---|---|
| 1 | District of Columbia | $40.83 |
| 2 | Alaska | $38.53 |
| 3 | Washington | $37.91 |
| 4 | Massachusetts | $37.38 |
| 5 | New Jersey | $37.30 |
| 6 | Illinois | $37.29 |
| 7 | California | $36.24 |
| 8 | New York | $35.94 |
| 9 | Minnesota | $35.57 |
| 10 | Maryland | $35.49 |
| 11 | Connecticut | $35.38 |
| 12 | New Hampshire | $34.37 |
| 13 | Colorado | $34.29 |
| 14 | North Dakota | $33.66 |
| 15 | Rhode Island | $33.55 |
Source: Highest-paying states for HVAC technicians by hourly mean wage. BLS Occupational Employment and Wage Statistics, May 2025. Chart below may be embedded with attribution to Bella FSM and a link to this page.
Notice what the list is not: it is not simply a cost-of-living ranking. North Dakota and Minnesota make the top fifteen while several expensive Sun Belt markets do not, because tight winters and tighter labor supply push wages up regardless of housing costs. Multi-crew operators who price the same in every branch, instead of running each market's numbers through their hvac business software, end up subsidizing their high-wage branches with their low-wage ones.
Wages are only one side of a technician's decision to stay or leave. For the career view of the same numbers, including how experience and certifications move individual pay, see our HVAC technician salary guide.
Ready to level up your business?
Try Bella FSM free and transform the way you work.
The largest HVAC labor markets
Volume tells a different story than pay. The fifteen states below employ the most HVAC technicians in the May 2025 BLS data, and only four of them also appear on the highest-pay list.
| Rank | State | HVAC technicians employed |
|---|---|---|
| 1 | Florida | 39,160 |
| 2 | California | 35,130 |
| 3 | Texas | 34,730 |
| 4 | New York | 24,430 |
| 5 | Pennsylvania | 15,880 |
| 6 | North Carolina | 15,230 |
| 7 | Virginia | 14,690 |
| 8 | Ohio | 14,150 |
| 9 | Michigan | 12,590 |
| 10 | Georgia | 12,290 |
| 11 | Arizona | 10,860 |
| 12 | New Jersey | 10,330 |
| 13 | Illinois | 9,740 |
| 14 | Tennessee | 9,740 |
| 15 | Colorado | 8,940 |
Source: States employing the most HVAC technicians. BLS Occupational Employment and Wage Statistics, May 2025.
Florida, Texas, and North Carolina run huge technician populations at wages below the top-fifteen cutoff, which is why their service markets compete hard on price and churn hard on people. In markets like these the durable advantage is rarely the rate; it is repeat business. A company that knows every system it has ever touched, because the equipment history lives in hvac crm software rather than in a departed technician's memory, can defend a mid-band rate that a stranger with a coupon cannot.
What should your fully loaded HVAC labor rate be?
A profitable billed rate is the technician's wage plus labor burden, divided by the share of paid hours that actually get billed, plus overhead and profit. That one sentence is the entire formula, and skipping any piece of it is how shops end up busy and broke. Burden covers payroll taxes, workers' comp, health insurance, and retirement. Utilization covers the truth that a technician paid for 2,080 hours a year bills far fewer once drive time, training, callbacks, and slow weeks are counted. Overhead covers everyone who never rides in the truck. The national numbers on this page give you defensible inputs: start from the $29.33 median or your real payroll, apply your own burden and utilization, and compare the output against the $75 to $150 market band before deciding where you can stand.
The formula
Billed labor rate = (hourly wage × burden multiplier) ÷ billable utilization + overhead and profit per billable hour. Every input should come off your own books; the worked example below shows the shape of the math with illustrative assumptions, not benchmarks.
A worked example at the national median
| Step | Illustrative assumption | Result |
|---|---|---|
| Technician wage | BLS May 2025 median | $29.33 per hour |
| Loaded cost | 35% labor burden | $39.60 per hour paid |
| Cost per billable hour | 70% of paid hours billed | $56.57 |
| Required billed rate | $35 overhead and profit per billable hour | about $92 |
Note: Worked example only. The wage is the BLS May 2025 national median; the burden, utilization, and overhead figures are illustrative assumptions a shop should replace with its own numbers.
Run at the national median with those assumptions and the math lands a little above $90 per hour, comfortably inside the HomeGuide band. Run the same math on a 75th percentile installer in Washington and it clears the top of the band, which is the point: the band is national, your inputs are not. Whatever rate you choose only becomes real when the technician bills it the same way on every ticket, which is a configuration job in hvac invoicing software, not a training speech.
To run the calculation on your own wage and overhead numbers, our labor rate calculator walks through the same steps interactively.
Ready to take your business further?
Start using Bella FSM free and work smarter.
Methodology and sources
Wage, employment, and percentile figures come from the U.S. Bureau of Labor Statistics Occupational Employment and Wage Statistics program, May 2025 estimates for occupation 49-9021, Heating, Air Conditioning, and Refrigeration Mechanics and Installers, retrieved from the BLS OEWS Profiles tool in September 2026. State rankings use the hourly mean wage and employment measures as published; relative standard errors are available at the source. The employment growth projection comes from the BLS Occupational Outlook Handbook, 2025 to 2035 projection cycle. Billed-rate, service call, diagnostic, and emergency pricing ranges come from HomeGuide's HVAC repair cost guide, accessed September 2026. The worked rate calculation is illustrative and is labeled as such where it appears. Figures on this page are reviewed when BLS publishes its next OEWS release, and the date at the top reflects the last review.
Media & citation: data on this page may be cited with attribution to Bella FSM and a link to this page.
Frequently Asked Questions
Set your rate before the season sets it for you
Every number on this page moves in one direction. Wages are climbing, the technician shortage is projected to outlast the decade, and the shops that thrive will be the ones whose hvac labor rates were built from their own costs rather than copied from the closest competitor. Benchmark against the tables here, rebuild the calculation each time payroll changes, and put the result on every ticket without apology. Bella FSM gives HVAC operators the scheduling, customer records, work orders, and invoicing to see their real cost per billable hour and defend the rate that covers it, and it takes minutes to try.
Ready to grow your business?
Try Bella FSM free and simplify your work.