
Grow Your Business
Among construction firms with open craft positions, 88% say those jobs are as hard or harder to fill than a year ago, according to the AGC and NCCER 2026 Workforce Survey released on September 3, 2026. That number explains most of what a general contractor feels on a Monday morning: a framing sub who cannot staff the job, a laborer who never shows, a schedule that slips before anyone swings a hammer. This page collects the construction labor shortage statistics a contractor needs in one place: the worker gap, federal job openings, the hardest trades to hire, what they are paid, and how the shortage varies by state. Owners who run their jobs inside general contractor software can hold these benchmarks up against their own crews.
Construction labor shortage statistics: the 2026 headline numbers
The construction industry needs to attract about 349,000 net new workers in 2026, according to the Associated Builders and Contractors workforce model published in January 2026 and summarized by NCCER. That is the smallest annual gap ABC has estimated in four years, down from 439,000 in 2025, but ABC projects it will jump back to 456,000 in 2027 as spending growth returns. Most of the 2026 demand comes from replacing retirees rather than from new work. Federal data points the same way: BLS Job Openings and Labor Turnover Survey figures show 326,000 open construction jobs at the end of July 2026 (preliminary), an openings rate of 3.8%, up from 305,000 and 3.6% a year earlier. In the AGC and NCCER 2026 survey, 87% of firms had openings for hourly craft workers, and one quarter of contractors had 11 or more craft positions unfilled.
ABC's annual worker-demand estimates
| Year | New workers needed |
|---|---|
| 2023 | 546,000 |
| 2024 | 501,000 |
| 2025 | 439,000 |
| 2026 | 349,000 |
| 2027 (projected) | 456,000 |
Source: Associated Builders and Contractors workforce model estimates for 2023 through 2027, as reported by NCCER, February 2026.
Open construction jobs in federal data
The JOLTS series is the cleanest monthly check on whether the gap is widening. Construction openings climbed from 266,000 in April 2026 to 326,000 in July 2026, per the BLS JOLTS release. For a small contractor, that trend shows up as fewer callbacks on job posts and subs who quote longer lead times.
In practice, a smaller worker gap on paper has not made hiring any easier. Build next season's calendar around the crew you can confirm, and let general contractor scheduling software show where one missing carpenter pushes every job behind it.
What do construction trades pay in 2026?
Wages are where the shortage lands on a contractor's books. The table uses BLS Occupational Employment and Wage Statistics for May 2025, the most recent national release, published in 2026.
| Occupation | Employment | Median hourly | Mean annual |
|---|---|---|---|
| First-line supervisors, construction trades | 812,210 | $38.42 | $86,450 |
| Plumbers, pipefitters, and steamfitters | 465,840 | $30.67 | $72,170 |
| Electricians | 757,220 | $30.38 | $71,490 |
| Carpenters | 670,090 | $29.12 | $65,630 |
| Drywall and ceiling tile installers | 83,080 | $28.33 | $63,600 |
| Cement masons and concrete finishers | 206,170 | $27.41 | $60,050 |
| Roofers | 135,490 | $26.65 | $58,140 |
| Painters, construction and maintenance | 225,190 | $23.75 | $55,420 |
| Construction laborers | 1,096,780 | $22.66 | $52,030 |
| All construction and extraction occupations | 6,425,160 | $28.63 | $65,360 |
Source: National employment and wage data by occupation, BLS Occupational Employment and Wage Statistics, May 2025. Self-employed workers are not included.
Two details matter for pricing. First, the gap between a laborer at $22.66 and a supervisor at $38.42 means a crew's cost depends heavily on its mix, not its headcount. Second, these are wage medians before payroll taxes, insurance, and benefits, so the loaded cost is always higher.
A shop that bids every job with one blended labor rate hides which crews make money. Tracking hours by role inside contractor business software turns the table above into a job-by-job margin check.
Ready to level up your business?
Try Bella FSM free and transform the way you work.
Which construction trades are hardest to hire?
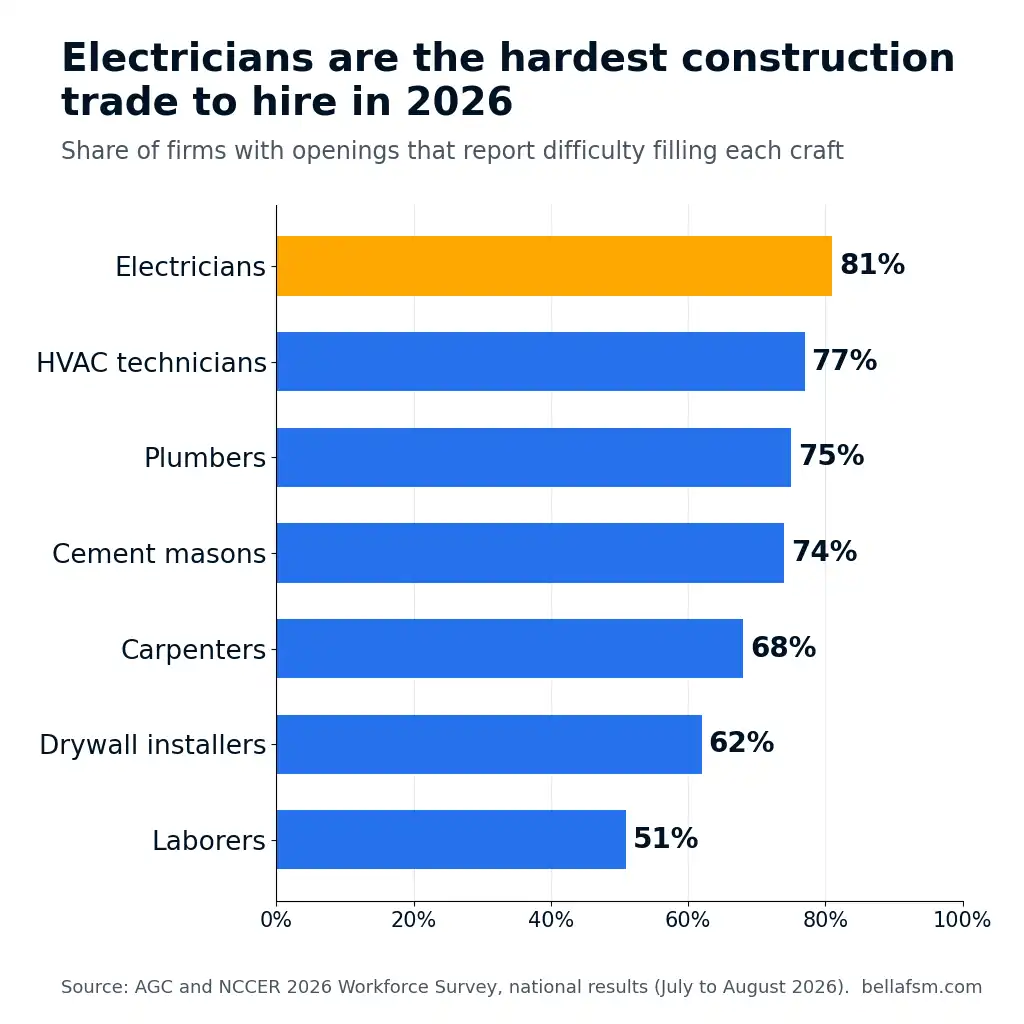
Electricians are the hardest construction trade to hire in 2026: 81% of firms with electrician openings report difficulty filling them, according to the AGC and NCCER 2026 Workforce Survey. Mechanics follow at 79%, HVAC technicians at 77%, and concrete workers at 76%, with plumbers and pipelayers close behind at 75%. The pattern favors licensed and mechanical trades, which take years to train and where a single missing worker can stall inspections and closeouts. General labor is the exception. Only 51% of firms with laborer openings report difficulty, the lowest share on the list, even though laborers account for the most openings of any craft (525 firms). For a general contractor, the hard-to-fill list is also a subcontractor risk list: if the electrical and mechanical subs you rely on cannot staff up, your schedule absorbs their shortage. Half of all respondents said available candidates lack the skills, certificates, or licenses the work requires.
| Craft position | Firms with openings | Report difficulty filling |
|---|---|---|
| Electricians | 103 | 81% |
| Mechanics | 235 | 79% |
| HVAC technicians | 52 | 77% |
| Concrete workers | 248 | 76% |
| Plumbers | 63 | 75% |
| Pipelayers | 138 | 75% |
| Cement masons | 145 | 74% |
| Sheet metal workers | 70 | 74% |
| Carpenters | 337 | 68% |
| Drywall installers | 77 | 62% |
| Laborers | 525 | 51% |
Source: AGC and NCCER 2026 Workforce Survey, national results, July and August 2026. The chart below visualizes this table and may be embedded with attribution to Bella FSM and a link to this page.
Keep a bench of at least two subs for every trade in the top half of this table, with their license numbers, insurance dates, and past job notes stored in general contractor crm software rather than in one project manager's phone.
Construction labor shortage by state
AGC and NCCER published separate 2026 results for 18 states with enough responses to report. The table ranks them by the share of firms whose projects were delayed by worker shortages, their own or their subcontractors'. Samples are small (20 to 82 firms per state), so treat single-point differences as noise and large gaps as signal.
| State | Responses | Firms with craft openings | Craft jobs harder to fill than a year ago | Worker shortages delayed projects | Affected by immigration enforcement |
|---|---|---|---|---|---|
| Idaho | 20 | 90% | 56% | 63% | 10% |
| Kentucky | 33 | 88% | 59% | 58% | 18% |
| Illinois | 22 | 91% | 55% | 55% | 24% |
| Missouri | 82 | 95% | 59% | 55% | 11% |
| North Carolina | 26 | 74% | 41% | 48% | 55% |
| Georgia | 26 | 62% | 44% | 44% | 46% |
| Texas | 70 | 87% | 68% | 44% | 45% |
| Ohio | 28 | 100% | 57% | 41% | 32% |
| Utah | 22 | 86% | 47% | 41% | 5% |
| Virginia | 21 | 81% | 53% | 40% | 38% |
| Colorado | 28 | 86% | 50% | 39% | 36% |
| Alabama | 21 | 86% | n/a | 38% | 57% |
| South Carolina | 20 | 85% | 18% | 32% | 45% |
| Kansas | 30 | 86% | 48% | 30% | 21% |
| Minnesota | 20 | 80% | 31% | 30% | 25% |
| Washington | 30 | 97% | 21% | 28% | 23% |
| California | 30 | 83% | 48% | 23% | 31% |
| Oregon | 20 | 80% | 63% | 20% | 15% |
| United States | 1,830 | 87% | 50% | 42% | 29% |
Source: AGC and NCCER 2026 Workforce Survey state fact sheets, compiled by Bella FSM, September 2026. Immigration column equals 100% minus firms reporting no impact. Alabama's "harder to fill" figure is not legible in its published fact sheet.
The state picture splits two ways. Idaho, Kentucky, and Missouri report the most delays from shortages but little immigration impact, which points to a thin local pipeline. In the Carolinas, Georgia, Texas, and Alabama, 45% to 57% of firms felt immigration enforcement. Nationally, the most common impact was subcontractors losing workers (16%).
If you work across county or state lines, plan each market's crew load separately. A contractor scheduling app that shows every crew's week on one board makes it obvious when a delayed sub in one market is about to pull your own people off another job.
Ready to take your business further?
Start using Bella FSM free and work smarter.
How are contractors responding to the shortage?
Contractors are responding to the labor shortage mainly by raising pay, and increasingly by fixing onboarding. In the AGC and NCCER 2026 survey, 55% of firms raised base pay for hourly craft workers by more than they did the year before, and another 29% matched last year's increase. Thirty-five percent started or increased spending on training, and 25% expanded in-person craft training on site. Recruiting has moved online: 49% added social media or targeted digital ads to reach younger applicants, and 48% deepened ties with high school, college, and career and technical programs. The retention numbers stand out more than the recruiting ones. Eighty-three percent of firms reported at least some turnover among new field employees in their first 90 days, and 42% said new hires fail to show up or quit shortly after starting. The top reason respondents gave for early exits was a mismatch between expectations and the reality of the work, ahead of the physical demands and travel or schedule requirements.
Pay is table stakes
When more than eight in ten firms raise pay at least as fast as last year, a raise keeps you even rather than ahead. You still have to do it, but it rarely solves the problem alone. Our guide on how to attract skilled field technicians covers the recruiting side in more depth.
The first 90 days decide most hires
The survey's most common fixes are structured onboarding, formal jobsite orientation, and a mentor or buddy system. Clear daily instructions help too. A new hire who opens a mobile field service app and sees tomorrow's address, scope, photos, and start time is less likely to feel lost by Thursday.
Write down what a new hire's first two weeks look like before you post the job. Then record who trained them and on what, alongside their customer and job history, in the contractor crm so the knowledge survives if they leave.
The cost of one early quit: a worked calculation
An early quit costs far more than the wages paid. The formula is: cost of an early quit = (ramp-up hours × loaded wage × unproductive share) + (supervisor hours × loaded supervisor wage) + recruiting spend. The table runs it for a carpenter at the BLS median wage.
| Step | Illustrative assumption | Result |
|---|---|---|
| Loaded carpenter wage | $29.12 BLS median plus 30% labor burden | $37.86 per hour |
| Unrecovered ramp-up pay | 120 hours over three weeks at 50% productivity | $2,271 |
| Supervisor time | 20 hours at $38.42 median plus 30% burden | $999 |
| Recruiting spend | Job ads and screening | $500 |
| Cost of one early quit | $3,770 |
Note: Worked example only. Wages are BLS OEWS May 2025 national medians; burden, hours, productivity, and recruiting figures are illustrative assumptions to replace with your own.
A contractor who loses four new hires a year in the first 90 days spends about $15,000 on people who never became productive, and that is before counting the schedule slip. On a job with progress billing, a crew that falls a week behind also pushes back the next draw request. Tying each billing milestone to completed work in general contractor invoicing software shows exactly which invoice a staffing gap is holding up.
That timing gap is where small firms often get squeezed. Our guide to contractor cash flow walks through how to cover payroll while a delayed draw is in the pipeline.
Methodology and sources
Survey figures come from the Associated General Contractors of America and NCCER 2026 Workforce Survey, conducted in July and August 2026 with 1,830 respondents and released on September 3, 2026, using the published survey analysis, national fact sheet, and 18 state fact sheets. State rows show each fact sheet's total responses. The trade table reports the share of firms with openings for each craft that found the position hard to fill. Worker-demand estimates come from the Associated Builders and Contractors workforce model as reported by NCCER in February 2026. Job openings come from the BLS Job Openings and Labor Turnover Survey, seasonally adjusted, with July 2026 figures preliminary. Wages come from BLS Occupational Employment and Wage Statistics, May 2025, which excludes the self-employed. Alabama's craft-difficulty figure is omitted because the source does not show it clearly. The early-quit calculation is illustrative. This page is reviewed when AGC publishes its next annual survey and when BLS releases new OEWS data.
Media & citation: data on this page may be cited with attribution to Bella FSM and a link to this page.
Frequently Asked Questions
Plan around the crew you can count on
The construction labor shortage statistics on this page point in one direction for small contractors: the market will not hand you more workers in 2026, so every job has to be planned around the people you can actually confirm. Keep a deep sub bench for the hardest trades, price with loaded wages instead of bare hourly rates, and treat the first 90 days of every hire as part of the job. When staffing slips, bill against the work that is done; progress billing software keeps each draw tied to real milestones so a short crew does not also become a cash problem. Bella FSM gives general contractors scheduling, customer and sub records, mobile job details, and invoicing in one place, so a thin crew can still run a full calendar.
Ready to grow your business?
Try Bella FSM free and simplify your work.