
Grow Your Business
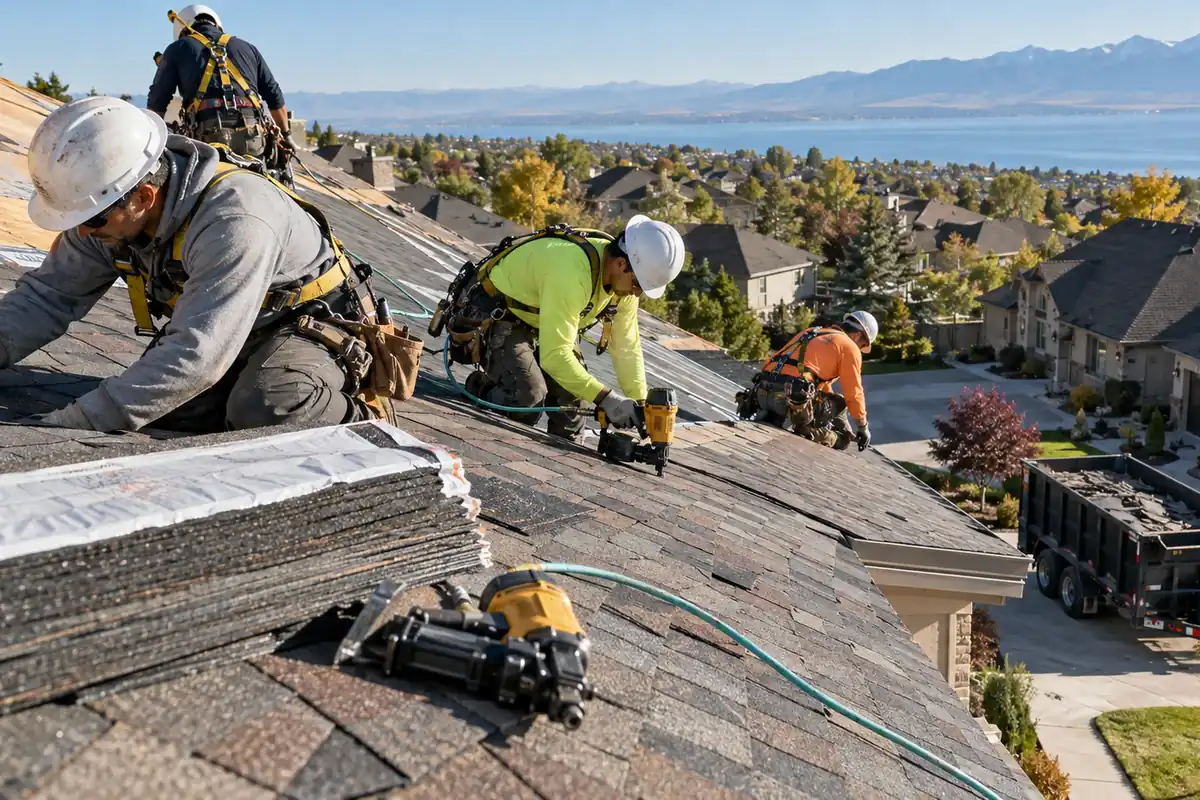
A tear-off crew in Chicago and a tear-off crew in Tulsa can do the same roof on the same day and carry payrolls more than $16 an hour apart per roofer. Roofers earned a national median of $26.65 an hour in May 2025, according to the Bureau of Labor Statistics Occupational Employment and Wage Statistics survey published in 2026, and state medians ran from $21.00 in Oklahoma to $37.45 in Illinois. This guide to roofing labor costs by state puts the BLS figures for all 50 states and DC in one table, adds foreman pay, and converts wages into the loaded crew hour an owner actually pays for. Whether you bid from roofing software or a legal pad, these numbers set the floor under every hiring offer and every price per square.
Roofing labor costs by state: the 2026 wage table
Roofing labor costs by state start with what roofers are paid, and the table below lists May 2025 BLS estimates for Roofers, occupation code 47-2181, which covers shinglers, tear-off hands and low-slope membrane installers employed by contractors. Each row shows how many roofers work in the state, the median and mean hourly wage, the median wage for first-line construction supervisors, and a loaded hourly cost for a median roofer. Use the median for a starting offer, because half of roofers earn more and half earn less. Nationally the median is $26.65 and the mean is $27.95, so experienced installers pull the average up by $1.30 an hour. The loaded column multiplies the median by 1.44, the construction benefit ratio explained further down. Treat state figures as a floor in big metro markets, where union scale and storm work push pay higher than the statewide number.
| State | Roofers employed | Median hourly | Mean hourly | Foreman median | Loaded roofer hour |
|---|---|---|---|---|---|
| Alabama | 1,010 | $21.96 | $23.01 | $30.83 | $31.62 |
| Alaska | 310 | $32.09 | $32.91 | $49.10 | $46.21 |
| Arizona | 3,420 | $22.76 | $24.33 | $37.76 | $32.77 |
| Arkansas | 950 | $22.82 | $22.01 | $29.44 | $32.86 |
| California | 21,190 | $30.58 | $32.41 | $46.96 | $44.04 |
| Colorado | 3,340 | $24.88 | $27.01 | $39.05 | $35.83 |
| Connecticut | 790 | $29.84 | $32.93 | $44.36 | $42.97 |
| Delaware | 230 | $28.58 | $26.58 | $38.99 | $41.16 |
| District of Columbia | 100 | $29.69 | $33.05 | $41.60 | $42.75 |
| Florida | 23,550 | $22.88 | $23.49 | $36.44 | $32.95 |
| Georgia | 2,160 | $22.57 | $23.29 | $37.71 | $32.50 |
| Hawaii | 1,110 | $28.64 | $29.53 | $49.34 | $41.24 |
| Idaho | 1,190 | $27.78 | $26.11 | $36.32 | $40.00 |
| Illinois | 5,300 | $37.45 | $37.33 | $50.84 | $53.93 |
| Indiana | 2,980 | $27.88 | $28.75 | $39.68 | $40.15 |
| Iowa | 930 | $23.39 | $25.04 | $37.75 | $33.68 |
| Kansas | 900 | $22.69 | $25.66 | $36.91 | $32.67 |
| Kentucky | 1,080 | $22.57 | $24.37 | $35.33 | $32.50 |
| Louisiana | 760 | $23.44 | $25.38 | $36.23 | $33.75 |
| Maine | 610 | $24.10 | $25.82 | $37.16 | $34.70 |
| Maryland | 2,050 | $28.89 | $29.63 | $37.87 | $41.60 |
| Massachusetts | 1,950 | $34.98 | $35.09 | $47.04 | $50.37 |
| Michigan | 3,090 | $28.62 | $29.54 | $37.59 | $41.21 |
| Minnesota | 1,890 | $35.81 | $35.06 | $46.93 | $51.57 |
| Mississippi | 480 | $21.61 | $21.77 | $32.17 | $31.12 |
| Missouri | 2,050 | $23.35 | $27.08 | $42.08 | $33.62 |
| Montana | 370 | $28.38 | $27.41 | $36.98 | $40.87 |
| Nebraska | 1,730 | $22.34 | $23.04 | $36.33 | $32.17 |
| Nevada | 2,120 | $24.56 | $27.62 | $39.42 | $35.37 |
| New Hampshire | 270 | $28.76 | $30.69 | $39.05 | $41.41 |
| New Jersey | 1,860 | $36.83 | $35.76 | $50.73 | $53.04 |
| New Mexico | 1,160 | $21.78 | $23.07 | $36.12 | $31.36 |
| New York | 4,570 | $31.74 | $33.34 | $46.01 | $45.71 |
| North Carolina | 3,060 | $23.56 | $24.06 | $36.19 | $33.93 |
| North Dakota | 290 | $28.72 | $29.11 | $39.12 | $41.36 |
| Ohio | 4,610 | $23.74 | $26.76 | $38.26 | $34.19 |
| Oklahoma | 1,260 | $21.00 | $23.61 | $35.11 | $30.24 |
| Oregon | 3,430 | $28.35 | $29.57 | $49.55 | $40.82 |
| Pennsylvania | 3,830 | $26.79 | $27.15 | $39.20 | $38.58 |
| Rhode Island | 360 | $29.63 | $30.57 | $47.40 | $42.67 |
| South Carolina | 850 | $22.00 | $24.13 | $36.23 | $31.68 |
| South Dakota | 400 | $22.94 | $22.59 | $37.35 | $33.03 |
| Tennessee | 2,110 | $21.97 | $22.47 | $35.81 | $31.64 |
| Texas | 5,740 | $22.13 | $22.69 | $35.83 | $31.87 |
| Utah | 2,710 | $23.40 | $24.80 | $37.15 | $33.70 |
| Vermont | 210 | $28.39 | $27.08 | $39.66 | $40.88 |
| Virginia | 2,070 | $23.28 | $24.77 | $37.81 | $33.52 |
| Washington | 5,890 | $29.16 | $33.11 | $52.68 | $41.99 |
| West Virginia | 440 | $24.60 | $24.56 | $38.49 | $35.42 |
| Wisconsin | 2,400 | $28.54 | $27.91 | $41.03 | $41.10 |
| Wyoming | 330 | $21.95 | $23.89 | $37.62 | $31.61 |
| United States | 135,490 | $26.65 | $27.95 | $38.42 | $38.38 |
Source: BLS Occupational Employment and Wage Statistics, May 2025 (published 2026), codes 47-2181 (Roofers) and 47-1011 (First-Line Supervisors of Construction Trades and Extraction Workers). Loaded cost: Bella FSM calculation, 2026, median wage multiplied by 1.44 from the BLS Employer Costs for Employee Compensation release for June 2026.
Highest and lowest paying states for roofers
Illinois leads at $37.45, followed by New Jersey at $36.83, Minnesota at $35.81, Massachusetts at $34.98 and Alaska at $32.09. The bottom five are Oklahoma at $21.00, Mississippi at $21.61, New Mexico at $21.78, Wyoming at $21.95 and Alabama at $21.96.
That is a gap of $16.45 an hour. An Illinois roofer costs about 78% more per hour than one in Oklahoma before a single dollar of payroll tax or insurance. A price per square that works in Tulsa loses money in Chicago.
Where roofing jobs are concentrated
Florida employs 23,550 roofers and California 21,190. Together they hold about 33% of the 135,490 roofing jobs BLS counted nationwide. Washington, Texas and Illinois follow, each with 5,300 to 5,890.
A big labor pool makes hiring easier, and it also makes it easier for a good installer to leave for the contractor down the road. Owners in those markets keep homeowner history, warranty dates and insurance claim notes in roofing CRM software instead of a foreman's phone, so the account stays when the crew changes.
Benchmark against your own state's median, not the national figure.
How much more do roofing foremen make than roofers?
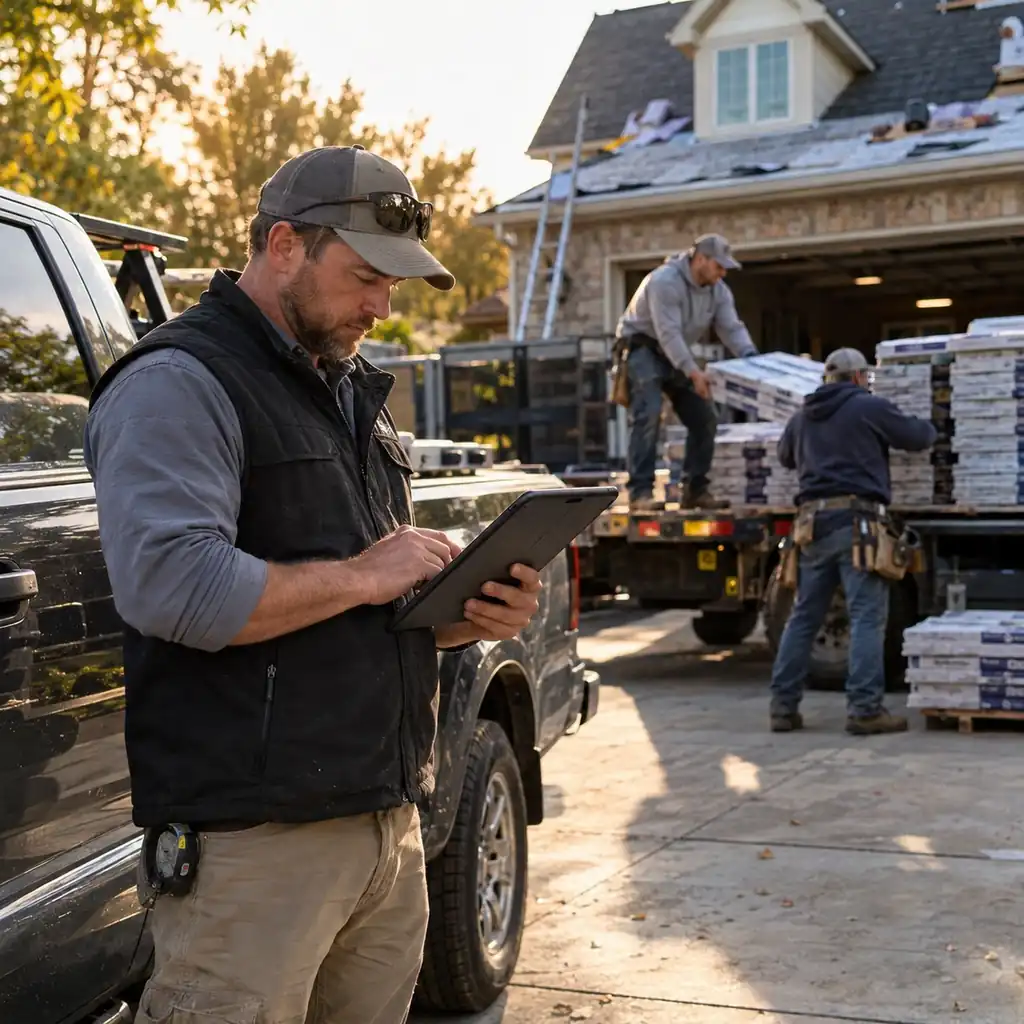
A roofing foreman typically earns about $11.77 an hour more than the roofers on the crew. The BLS May 2025 national median for First-Line Supervisors of Construction Trades and Extraction Workers (code 47-1011) was $38.42, compared with $26.65 for roofers, a premium of roughly 44%. BLS does not publish a roofing-only supervisor code, so this figure blends roofing foremen with supervisors from every building trade. Read it as a ceiling for a working foreman who still nails shingles and a fair mark for a production manager who runs several crews. The premium swings widely by state. Among the ten largest roofing labor markets it runs from $12.41 in Pennsylvania to $23.52 in Washington. Where the premium is thin, your best installer has little reason to take on the paperwork, the safety plan and the homeowner walk-through. Where it is wide, promoting from inside is usually cheaper than hiring an outside foreman who has never run your jobs.
| State | Roofers employed | Roofer median | Foreman median | Premium per hour | Premium % |
|---|---|---|---|---|---|
| Florida | 23,550 | $22.88 | $36.44 | $13.56 | 59% |
| California | 21,190 | $30.58 | $46.96 | $16.38 | 54% |
| Washington | 5,890 | $29.16 | $52.68 | $23.52 | 81% |
| Texas | 5,740 | $22.13 | $35.83 | $13.70 | 62% |
| Illinois | 5,300 | $37.45 | $50.84 | $13.39 | 36% |
| Ohio | 4,610 | $23.74 | $38.26 | $14.52 | 61% |
| New York | 4,570 | $31.74 | $46.01 | $14.27 | 45% |
| Pennsylvania | 3,830 | $26.79 | $39.20 | $12.41 | 46% |
| Oregon | 3,430 | $28.35 | $49.55 | $21.20 | 75% |
| Arizona | 3,420 | $22.76 | $37.76 | $15.00 | 66% |
Source: BLS OEWS May 2025, codes 47-2181 and 47-1011. The ten states shown employ the most roofers.
The foreman earns that premium by keeping production moving. When the day's job, material drop and crew assignments come from service scheduling software, the foreman spends the morning on the roof instead of on the phone.
Set foreman pay from your state's premium, and write down what the role owns.
Ready to level up your business?
Try Bella FSM free and transform the way you work.
What does a roofer really cost per hour?
The loaded labor cost formula
A roofer costs about 44% more than their hourly wage once benefits and payroll taxes are counted. The BLS Employer Costs for Employee Compensation release for June 2026 shows private construction employers paid $15.84 in benefits for every $36.13 in wages, which works out to 44 cents per wage dollar. Legally required benefits (Social Security, Medicare, unemployment insurance and workers' compensation) came to $4.42 of that, or about 12 cents per wage dollar. The working formula is simple: loaded hourly cost equals the hourly wage multiplied by 1.44. At the national median of $26.65, a roofer costs $38.38 an hour. A small company with no health plan or retirement match will land closer to 1.12, or $29.85 at the median. Workers' compensation for roofers, though, costs far more than the construction average built into that ratio, so roofers need one more adjustment.
Workers' comp is where roofing costs break away
Across all private construction, workers' compensation averaged $1.10 per hour worked in June 2026, according to the same BLS release, compared with $0.43 for private industry as a whole.
Roofing sits far above that average. Washington Labor and Industries sets a 2026 base rate of $5.7930 per hour worked for risk class 0507, Roof Work: Construction and Repair. That is 7.3 times the state's all-class average of $0.7885 and 4 times the $1.4370 rate for electrical wiring. Washington lets employers deduct part of the premium from workers' pay, so the employer's share is somewhat lower.
Most other states price it as a percentage of payroll. In Texas, the Department of Insurance lists a July 1, 2026 loss cost of 1.946 for code 5551 (Roofing), per $100 of payroll, before each carrier applies its own multiplier. For your own math, use the rate on your policy declarations page.
| Washington roofer, per hour | Amount |
|---|---|
| Median wage (BLS OEWS May 2025) | $29.16 |
| Loaded at the construction average (x 1.44) | $41.99 |
| Loaded without average comp (x 1.41) | $41.12 |
| Plus class 0507 base rate (L&I 2026) | $5.79 |
| Loaded with roofing comp | $46.91 |
Source: Bella FSM calculation, 2026. Washington median roofer wage from BLS OEWS May 2025; benefit ratio from BLS ECEC June 2026 with its $1.10 construction workers' comp share removed (1.41); class 0507 base rate from Washington L&I 2026 rates.
Loaded labor also has a cash side. A roof that is finished on Friday but billed two weeks later still had its payroll paid on Friday. Field service invoicing software that sends the invoice when the crew marks the job complete closes that gap.
To test your own burden, run your wage, benefits and comp rate through our labor rate calculator. Price from the loaded number, never from the wage.
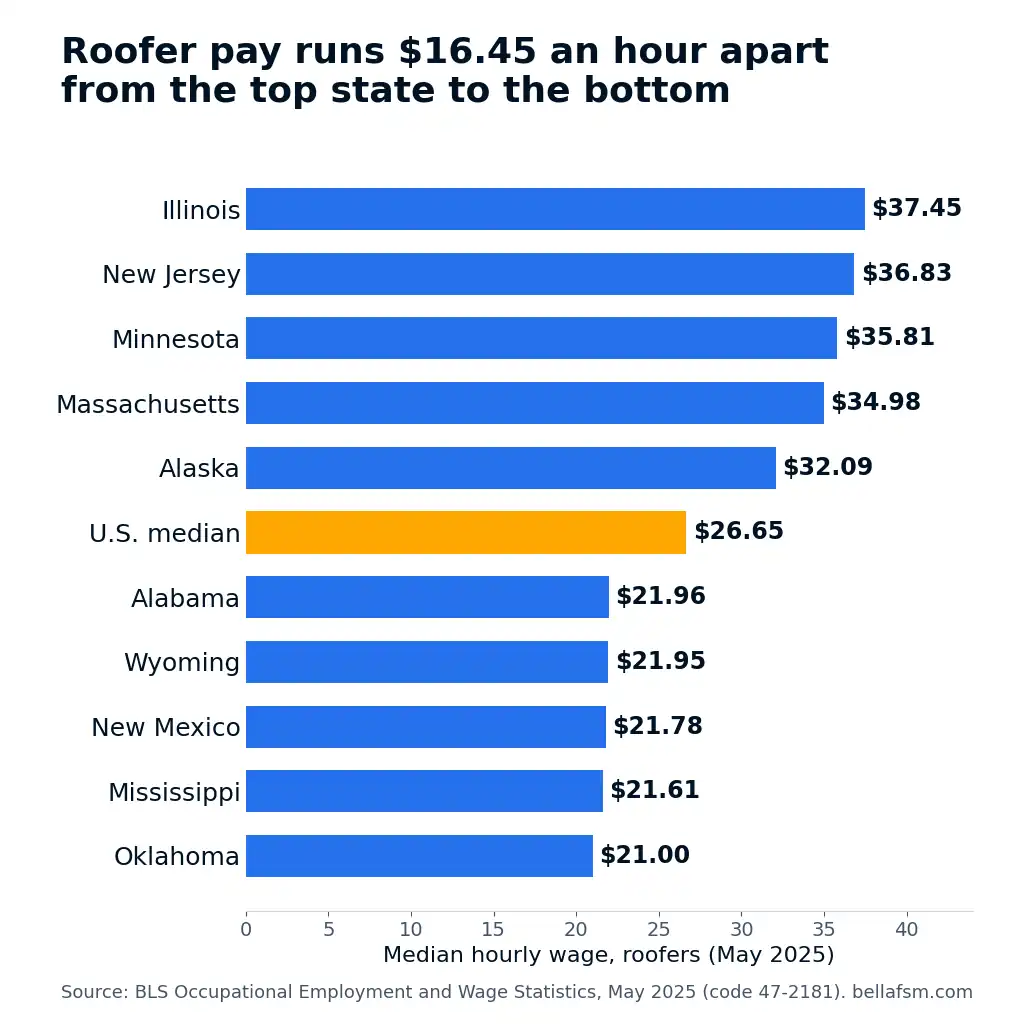
Chart: Median hourly roofer wage, five highest and five lowest states versus the U.S. median. Source: BLS OEWS, May 2025. Chart may be embedded with attribution to Bella FSM and a link to this page.
From crew hour to labor cost per square
Homeowners compare bids per square, so labor has to be converted into that unit. Start with the crew hour. As an illustration, take a four-person crew of one foreman and three roofers, all paid at their state medians and loaded at 1.44. At national medians that crew costs $170.45 per clock hour. In Florida it costs $151.32, in Texas $147.20, and in Illinois $234.99.
Many contractors who run on roofing contractor software already track squares per crew day on each job, which is the second half of the formula.
The labor cost per square formula
Labor cost per square equals the loaded crew hour multiplied by paid hours per day, divided by squares installed that day. The production rates below are illustrative, not benchmarks. Pitch, layers, tear-off, decking repairs and travel all move them.
| Labor cost per square | National | Florida | Texas | Illinois |
|---|---|---|---|---|
| Loaded crew hour | $170.45 | $151.32 | $147.20 | $234.99 |
| 10 squares per 8-hour day | $136.36 | $121.06 | $117.76 | $187.99 |
| 12 squares per 8-hour day | $113.63 | $100.88 | $98.13 | $156.66 |
| 16 squares per 8-hour day | $85.22 | $75.66 | $73.60 | $117.50 |
Source: Bella FSM calculation, 2026, using BLS OEWS May 2025 state medians (47-2181 and 47-1011), a 1.44 loaded multiplier from BLS ECEC June 2026, an illustrative four-person crew and an 8-hour paid day. Production rates are examples only.
A crew that installs 12 squares a day in Illinois spends $156.66 per square on labor. The same output in Florida costs $100.88. The whole difference comes from wages, before materials, disposal, overhead or profit.
To replace these sample production rates with your own, a mobile field service app with clock-in and job timers records paid hours against squares installed for every job.
Labor is only one layer of the bid. Our guide on how to price a roofing job covers the material, overhead and margin layers that sit on top.
Measure squares per crew day for a month before you trust any per-square labor number.
Ready to take your business further?
Start using Bella FSM free and work smarter.
How should roofing contractors plan crews around labor costs?
Roofing contractors should plan crew count from what they can afford to pay at their state's median, then sell only the squares those crews can install. The BLS Occupational Outlook Handbook projects roofer employment to grow 5% from 2025 to 2035, faster than the average for all occupations, with about 12,000 openings a year. Most of those openings replace roofers who leave the trade, so experienced installers stay scarce every spring. The handbook also notes that roofing work slows in northern states during winter, while summer often brings overtime. That pattern matters for cost. Overtime at time and a half pushes a $38.38 loaded hour past $50 once the premium is added, and a crew that runs Saturdays for six weeks can wipe out the margin on a whole month of jobs. Sell the season against your real crew capacity and keep overtime for storm work that pays for it.
Matching backlog to crew capacity
A booked roof is only profitable if a crew can reach it before the price is stale. Putting signed jobs on field service scheduling software next to crew availability shows when sales has outrun production by three weeks.
Our walkthrough of a roofing production schedule covers sequencing tear-offs, inspections and material drops so crews are not paid to wait.
Keeping the crews you have
Turnover hurts less when no account depends on one person. Keep homeowner warranties, photos and callback history in a crm for roofing contractors, so a new foreman can pick up any account without a phone call.
Plan crews from wages you can afford, then sell squares to fit.
Methodology and sources
Wage figures come from the BLS Occupational Employment and Wage Statistics program (May 2025 reference period, published 2026), retrieved through the BLS public data API in October 2026. Roofers are code 47-2181; foremen use code 47-1011, which covers supervisors across all construction trades. OEWS surveys employers only, so self-employed roofers are excluded, which explains why the Occupational Outlook Handbook counts 166,900 roofing jobs against the 135,490 wage earners in our table.
The 1.44 multiplier is the benefit-to-wage ratio for private construction industry workers in the BLS Employer Costs for Employee Compensation release for June 2026. Workers' comp figures come from Washington L&I 2026 base rates and the Texas Department of Insurance rate guide. The four-person crew and the production rates are illustrative.
This page will be reviewed in spring 2027, when BLS publishes the May 2026 estimates.
Media & citation: data on this page may be cited with attribution to Bella FSM and a link to this page.
Frequently Asked Questions
Putting roofing labor costs by state to work
Use roofing labor costs by state for three decisions: hiring offers from your state's roofer median, foreman pay from its supervisor premium, and price per square from a loaded crew hour of about 1.44 times wages plus your real comp rate. Then measure squares per crew day so the math runs on your crews, not ours. When finished roofs move into field service billing software the same day, cash keeps pace with payroll. Bella FSM keeps jobs, crews, time on site and invoices in one system, so you can check your labor cost against these benchmarks every week. Start a free trial and see what your crew hour really costs.
Ready to grow your business?
Try Bella FSM free and simplify your work.