
Grow Your Business

Running a septic business means managing far more than pumping tanks. Pricing, technician wages, recurring service intervals, route density, disposal requirements, state regulations, equipment utilization, and workforce availability can all affect profitability.
This guide brings together the latest credible public data we could verify from the U.S. Environmental Protection Agency, U.S. Census Bureau, U.S. Bureau of Labor Statistics, state agencies, and university extension programs.
Where a reliable national benchmark does not exist, we say so rather than presenting an unsupported average.
Data note
Government statistics often lag by one or more years. This page uses the most recent verified data available as of September 2026 and identifies the underlying data year whenever possible.
1 in 5U.S. homes served by a septic system
4,054Employer establishments in NAICS 562991
$23.84Mean hourly wage, septic tank servicers
3 to 5 yearsTypical household pump-out interval
Septic industry benchmarks at a glance
| Benchmark | Latest verified figure |
|---|---|
| U.S. homes using septic systems | About 1 in 5 |
| Employer establishments in NAICS 562991 | 4,054 |
| Septic tank servicer and sewer pipe cleaner employment | 27,900 workers |
| Mean hourly wage | $23.84/hour |
| Mean annual wage | $49,590/year |
| Median hourly wage | $22.56/hour |
| Typical household pump-out interval | Every 3 to 5 years |
| Typical septic tank capacity | 1,000 to 2,000 gallons |
| Public pumping-price benchmark | $250 to $400 |
| 2022 industry revenue | $6.348 billion |
| 2021 industry revenue | $5.475 billion |
| 2021 to 2022 revenue increase | 15.9% |
Classification note
NAICS 562991, Septic Tank and Related Services, includes establishments primarily engaged in septic and cesspool pumping and/or portable toilet rental and servicing. Industry-wide Census figures should therefore not be interpreted as septic pumping businesses alone.
Sources for the table above: septic prevalence, pumping interval and tank capacity from the U.S. EPA; employment and wages from the U.S. Bureau of Labor Statistics; establishment counts and revenue from the U.S. Census Bureau, NAICS 562991: Septic Tank and Related Services; pumping-price range from the University of Maryland Extension. Each figure is cited again in full in its own section below.
How large is the septic service industry?
Septic systems serve a substantial portion of the United States. The EPA reports that approximately one in five U.S. homes use septic systems rather than centralized sewer systems. That creates a large installed base requiring pumping, inspection, maintenance, repair, and eventual replacement.
Source: U.S. EPA, Septic System Care and Maintenance
The concentration can be significantly higher in individual states. The University of Florida's IFAS Extension reported in February 2026 that roughly 30% of Floridians rely on onsite septic systems.
Source: University of Florida IFAS Extension, Septic Systems
For septic contractors, that installed base is important because demand is not driven solely by new construction. Existing systems create recurring maintenance requirements throughout their service lives.
How many septic businesses are there in the United States?
The U.S. Census Bureau's 2023 County Business Patterns data reports 4,054 employer establishments classified under NAICS 562991, Septic Tank and Related Services.
The same data shows how heavily the industry is concentrated among smaller operations:
| Establishment size | Number of establishments |
|---|---|
| Fewer than 5 employees | 2,385 |
| 5 to 9 employees | 865 |
| 10 to 19 employees | 457 |
| 20 to 49 employees | 256 |
| 50 to 99 employees | 61 |
| 100 to 249 employees | 27 |
| 250 to 499 employees | 3 |
That means approximately 59% of employer establishments have fewer than five employees, while roughly 80% have fewer than ten employees.
This is especially relevant for software, staffing, routing, and equipment decisions because the industry is dominated by relatively small operating locations rather than only large national companies. At that size the same person often runs dispatch, billing and the truck on the same day, so septic company software has to cover all three rather than specialize in one.
An establishment represents a business location rather than necessarily a unique company. A company operating multiple locations can therefore appear more than once.
Source: U.S. Census Bureau, 2023 County Business Patterns for NAICS 562991
What does septic tank pumping cost?
There is no single federal statistic establishing the current average residential septic pumping price across the entire United States.
One of the more useful publicly available benchmarks comes from the University of Maryland Extension, which reports that typical septic tank pumping costs are approximately $250 to $400, depending on tank size and location.
Source: University of Maryland Extension, FAQs on Septic Systems
That range should be treated as a reference point rather than a pricing recommendation. Actual customer pricing can differ substantially based on tank capacity, travel distance, disposal fees, buried lids, difficult access, locating requirements, inspection work, emergency service, and regional labor costs.
Virginia Tech's Cooperative Extension specifically notes that septic-cleaning charges can vary considerably and that additional fees may apply when a contractor must locate or uncover a tank.
Source: Virginia Tech, What to Expect When Getting Your Septic Tank Pumped
Pumping price is not the same as average service ticket
A pumping price should not be confused with the total value of a septic service visit.
For example, Penn State Extension reported in March 2026 that a complete on-lot septic inspection associated with a real-estate transaction, including required pumping, can cost approximately $625 to $1,200, depending on system size and complexity.
Source: Penn State Extension, On-Lot Septic System Inspections During Real Estate Transactions
A business performing inspections, filter service, repairs, locating, riser installation, compliance work, and pumping may therefore generate a substantially higher average invoice than a pump-only operation. Whether that added work actually reaches the ticket is a billing question, which is why septic service invoicing software tracks line items per visit rather than one flat service charge.
How often should septic tanks be pumped?
The strongest national benchmark is every three to five years.
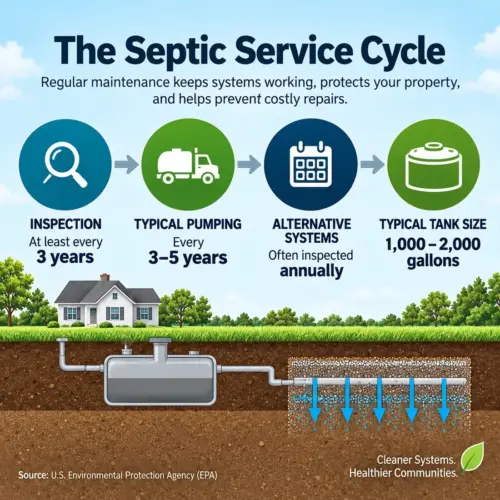
The U.S. EPA says household septic tanks are typically pumped every 3 to 5 years and recommends that the average household septic system be inspected at least every three years by a septic professional.
EPA identifies household size, total wastewater generated, solids volume, and septic tank size as important factors determining actual pumping frequency.
Alternative systems containing mechanical components such as pumps and float switches generally require more frequent inspection, often once per year.
Source: U.S. EPA, How to Care for Your Septic System
The University of Maryland Extension independently gives the same average 3 to 5 year pumping interval in guidance updated May 15, 2025.
Source: University of Maryland Extension, Septic Pumping
For septic companies, this recurring maintenance cycle creates an important customer-retention opportunity. A completed pump-out today can create another scheduled service several years later if the business accurately records the property, tank information, service history, and recommended return date. Holding that history against the property rather than in a technician's memory is the job of septic service CRM software.
What is the typical septic tank size?
EPA technical guidance states that septic tank capacity commonly ranges from approximately 1,000 to 2,000 gallons.
Source: U.S. EPA, Decentralized Systems Technology Fact Sheet: Septic Tank
Another EPA technical document gives a practical sizing example: a three-bedroom house with four occupants and no water-saving fixtures would require approximately a 1,000-gallon septic tank under the example design criteria.
Source: U.S. EPA, Septic System Tank Technology Fact Sheet
There is no universal residential tank size. EPA explains that septic system size and design vary based on household size, soil type, site slope, lot size, proximity to sensitive water bodies, weather conditions, and local regulations.
Source: U.S. EPA, Types of Septic Systems
For contractors, tank capacity affects pumping time, available truck capacity, disposal frequency, scheduling, and ultimately job profitability.
Average septic technician wage
The closest national occupational benchmark published by the U.S. Bureau of Labor Statistics is SOC 47-4071, Septic Tank Servicers and Sewer Pipe Cleaners.
BLS reported approximately 27,900 workers nationally in this occupation in May 2023.
| Wage benchmark | May 2023 |
|---|---|
| Mean hourly wage | $23.84 |
| Mean annual wage | $49,590 |
| Median hourly wage | $22.56 |
| Median annual wage | $46,910 |
| 75th percentile hourly wage | $27.53 |
| 90th percentile hourly wage | $33.03 |
Source: U.S. Bureau of Labor Statistics, Septic Tank Servicers and Sewer Pipe Cleaners
These figures should not be interpreted as a pure septic pumping technician salary. The BLS occupation also includes workers who clean and repair sewer lines and drains.
Even with that limitation, it provides one of the strongest nationally consistent labor-cost benchmarks available to septic business owners.
Septic technician wages vary by state
The same BLS dataset shows meaningful geographic differences.
Among states with high employment in this occupation, May 2023 mean annual wages included $61,380 in Washington, $51,910 in California, $50,950 in New York, $47,720 in Michigan, and $41,930 in Texas.
A septic contractor in Washington therefore operates in a substantially different labor market than one in Texas.
Source: U.S. Bureau of Labor Statistics, state wage data for Septic Tank Servicers and Sewer Pipe Cleaners
This is one reason contractors should base labor rates and pricing on their actual local hiring market rather than applying one national wage figure everywhere.
How fast is the septic industry growing?
U.S. Census Bureau Service Annual Survey data shows total revenue for Septic Tank and Related Services of approximately $6.348 billion in 2022, compared with $5.475 billion in 2021.
That represents approximately 15.9% nominal year-over-year revenue growth.
Source: U.S. Census Bureau data via FRED, Total Revenue for Septic Tank and Related Services
Looking further back, the same Census series shows industry revenue of approximately $1.87 billion in 1998 and $6.348 billion in 2022.
That works out to roughly 5.2% compound annual nominal revenue growth over those 24 years.
Source: FRED, Historical Census Revenue Data for NAICS 562991
These figures are not adjusted for inflation and therefore should not be interpreted as equivalent growth in physical service volume.
They do, however, show that the dollar value of septic tank and related services has increased substantially over time.
What are typical septic business profit margins?
There is not a reliable public national gross-margin benchmark specifically for septic businesses that we would recommend treating as authoritative.
The Census Bureau does publish industry-level revenue and expense data. For 2022, available Census Service Annual Survey data shows industry revenue of $6.348 billion against industry expenses of $4.602 billion.
The difference is approximately $1.746 billion, or about 27.5% of revenue.
Revenue source: U.S. Census Bureau data via FRED, Septic Industry Revenue
Expense source: U.S. Census Bureau data via FRED, Septic Industry Expenses
Read this before quoting 27.5%
That does not mean the average septic business has a 27.5% gross margin. The Census expense measure is broader than traditional accounting cost of goods sold, and NAICS 562991 also includes portable toilet operations.
The calculation is best treated as a broad industry operating-spread proxy, not a target gross margin for an individual company.
For an individual septic contractor, metrics such as gross profit per job, labor percentage, fuel cost per job, disposal cost per job, average invoice, revenue per technician, and revenue per truck are substantially more useful. Those come off completed jobs and paid invoices, so the reporting is only ever as good as what gets captured at the truck. That is the practical case for septic billing software over a spreadsheet rebuilt at month end.
How many septic jobs should one truck complete per day?
There is currently no credible national government or university benchmark for the average number of septic pumping jobs completed per truck per day.
That distinction matters because numbers frequently repeated online may come from individual companies, software vendors, or unsupported estimates rather than a representative industry study.
Virginia Tech notes that job duration can change based on how easily the tank can be accessed, tank size, and unexpected problems such as broken baffles or roots entering the system.
Source: Virginia Tech, What to Expect When Getting Your Septic Tank Pumped
For this reason, jobs per truck per day is better treated as an internal operating KPI than a universal industry benchmark.
A rural operator covering a large territory can have a highly profitable day with fewer jobs than a suburban company running tightly clustered routes.
Septic route density and travel distance
There is also no reliable national primary-source statistic for average miles traveled per septic service call. But travel can materially affect profitability.
A truck completing six geographically concentrated calls can outperform a truck completing the same number of calls across a large rural service territory once technician time, fuel, vehicle wear, and disposal trips are considered.
EPA technical guidance recognizes site location and accessibility as factors affecting septic-service cost.
Source: U.S. EPA, Decentralized Systems Technology Fact Sheet
For individual companies, miles per completed job and revenue per route mile may provide better operating insight than job count alone. Both are route-planning measures, and both are easier to hold steady when the day is built in septic service scheduling software rather than assembled call by call.
How much does it cost to start a septic business?
There is no authoritative national government benchmark for the total cost of starting a septic pumping company.
A credible startup estimate has to account for variables such as vacuum-truck acquisition, financing, insurance, licensing, waste-disposal access, equipment storage, employee costs, inspection capability, repair equipment, and the services offered.
State requirements can add additional complexity. For example, South Carolina requires septic pumper and hauler applicants to identify the sewage-disposal facilities they intend to use and provide written authorization from those facilities.
Source: South Carolina Department of Environmental Services, Licensing for Septic Pumper/Haulers
That illustrates why starting a septic company involves more than simply purchasing a pump truck.
Because no credible primary-source national startup-cost average exists, we do not recommend presenting one as an industry benchmark.
Septic regulations vary significantly by state
There is no single set of regulations governing every septic contractor in the United States.
EPA provides national guidance, but installation, pumping, inspections, waste transportation, disposal, operator licensing, property transfers, alternative systems, and maintenance reporting can be regulated differently by individual states and local jurisdictions.
Massachusetts Title 5 requirements include septic-system inspections connected to real-estate transactions and certain changes in property use.
Source: Massachusetts, Septic Systems and Title 5
Virginia requires operation and maintenance requirements for Alternative Onsite Sewage Systems, including recurring inspection requirements.
Source: Virginia Department of Health, Operation and Maintenance for Existing Onsite Sewage Systems
South Carolina has separate pumper and hauler licensing and approved-disposal requirements.
Source: South Carolina DES, Septic Pumper/Hauler Licensing
Large-capacity septic systems
EPA defines a large-capacity septic system as a system receiving solely sanitary waste that serves 20 or more persons per day, either from multiple dwellings or from a non-residential establishment.
Those systems can be subject to additional federal Underground Injection Control requirements.
Source: U.S. EPA, Large-Capacity Septic Systems
For companies working across counties or states, regulatory differences can therefore affect recordkeeping, scheduling, technician qualifications, service frequency, disposal, and customer communication. Every one of those is a property-level detail, which is where septic customer management software earns its keep across a multi-county service area.
Is the septic industry facing a workforce shortage?
Unlike several of the other metrics in this report, there is no need to infer whether a workforce shortage exists.
The EPA explicitly says the decentralized wastewater sector is experiencing a shortage of qualified workers to design, install, maintain, and inspect onsite systems.
EPA identifies several contributing factors, including a large number of existing systems requiring routine maintenance, continued system installations, and an aging workforce expected to retire in significant numbers.
Source: U.S. EPA, Decentralized Wastewater Treatment Workforce and Training Centers
EPA has also published a dedicated report, Pipeline to a Strong Workforce: Decentralized/Onsite Wastewater Occupations, examining career pathways, workforce demand, training requirements, growth projections, and challenges contributing to the shortage of decentralized wastewater workers.
Source: U.S. EPA, Pipeline to a Strong Workforce
What is not available is one defensible national percentage saying the septic industry is short a specific number or percentage of technicians.
For an individual septic company, time-to-hire, applicant volume, technician turnover, overtime, training time, and jobs postponed because of staffing shortages are more actionable measures. A staffing problem usually shows on the dispatch board well before it shows in revenue, which makes septic dispatch software an early warning as much as a routing tool.
What do these septic business benchmarks mean?
Several conclusions stand out from the data.
- Recurring service is fundamental to the industry. A typical 3 to 5 year pumping interval means every properly documented pumping visit can create a future customer touchpoint.
- Small businesses dominate the industry. Census data shows that approximately four out of five employer establishments in NAICS 562991 employ fewer than ten people. That makes efficient scheduling, equipment utilization, technician productivity, and cash flow especially important.
- Route efficiency matters. There is no national correct number of jobs per truck because territory density, travel time, disposal distance, tank access, and service mix differ too much between companies.
- Labor markets differ substantially by region. National wage data provides a useful benchmark, but a company's real labor cost needs to reflect its own hiring market.
- The most useful benchmarks are not in national datasets. Revenue per truck, miles per job, disposal cost per job, gross profit per service call, recurring-service retention, and technician utilization all have to come from the company's own records. That makes a septic company's own operating data particularly valuable.
Septic business KPIs worth tracking
| KPI | What it tells you |
|---|---|
| Jobs per truck per day | Field capacity |
| Revenue per truck | Equipment productivity |
| Average invoice | Pricing and service mix |
| Revenue per route mile | Route efficiency |
| Miles per completed job | Geographic efficiency |
| Technician utilization | Productive labor time |
| Disposal cost per job | Variable service cost |
| Fuel cost per job | Route and vehicle efficiency |
| Gross profit per job | Actual job economics |
| Repeat customer rate | Customer retention |
| Future services scheduled | Recurring revenue potential |
| Days to payment | Cash-flow efficiency |
Managing septic business data with Bella FSM
As a septic company grows, maintaining these records across paper work orders, spreadsheets, separate calendars, text messages, and technician notes becomes increasingly difficult.
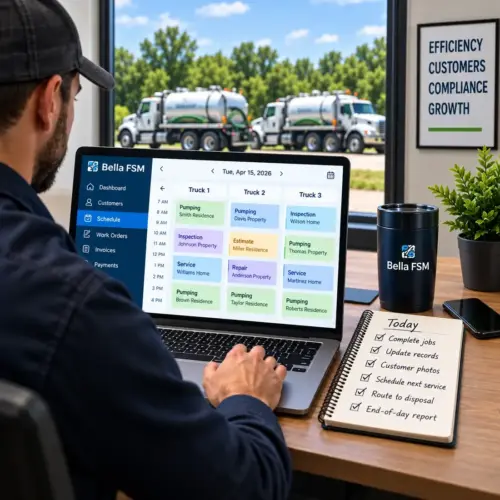
Bella FSM's septic business software helps contractors manage customer and property records, recurring service, scheduling, dispatch, technicians, work orders, estimates, invoices, payments, and field activity from one system.
For an industry with service intervals measured in years, keeping accurate property history can be particularly important. A company can maintain previous service dates, system information, work history, technician notes, photos, documents, estimates, invoices, and recommended future service without relying on an employee remembering what happened at the property several years earlier.
Sources and methodology
This report prioritizes government agencies and university extension programs over commercial market reports and unsourced online statistics. Four figures on this page are calculations by Bella FSM using the underlying government data rather than published statistics: the 15.9% year-over-year revenue increase, the 5.2% compound annual growth rate, the establishment-size percentages, and the 27.5% revenue-to-expense spread.
U.S. Environmental Protection Agency
- How to Care for Your Septic System: pumping and inspection frequency, maintenance factors.
- Septic System Care and Maintenance: prevalence of septic systems in U.S. homes.
- Types of Septic Systems: system types and variables affecting septic-system design.
- Large-Capacity Septic Systems: federal definition and requirements for large-capacity systems.
- Decentralized Systems Technology Fact Sheet: Septic Tank: typical septic tank capacity range.
- Septic System Tank Technology Fact Sheet: worked tank-sizing example.
- Decentralized Systems Technology Fact Sheet, large-flow applications: site location and accessibility as cost factors.
- Decentralized Wastewater Treatment Workforce and Training Centers: workforce-shortage findings and training resources.
- Pipeline to a Strong Workforce: Decentralized/Onsite Wastewater Occupations: workforce pathways, demand, training requirements, and shortage challenges.
U.S. Census Bureau
- 2023 County Business Patterns, NAICS 562991: employer establishments and establishment-size distribution.
- NAICS 562991 Industry Profile: industry definition and business profile.
- Census Service Annual Survey Revenue Data via FRED: industry revenue.
- Census Service Annual Survey Expense Data via FRED: industry expenses.
- Full historical Census revenue series via FRED: 1998 to 2022 revenue used for the compound growth calculation.
U.S. Bureau of Labor Statistics
- Septic Tank Servicers and Sewer Pipe Cleaners, May 2023: national employment, wages, and geographic wage data.
University and state sources
- University of Maryland Extension, Septic Pumping: 3 to 5 year pumping interval.
- University of Maryland Extension, Septic System FAQs: public pumping-cost benchmark.
- University of Florida IFAS Extension, Septic Systems: share of Florida households on onsite systems.
- Virginia Tech, What to Expect When Getting Your Septic Tank Pumped: service-time, access, and pricing considerations.
- Penn State Extension, On-Lot Septic System Inspections During Real Estate Transactions: inspection and pumping costs.
- Massachusetts, Septic Systems and Title 5: state septic regulations.
- Virginia Department of Health, Onsite Sewage Operation and Maintenance: alternative onsite system requirements.
- South Carolina DES, Septic Pumper/Hauler Licensing: pumper licensing and disposal requirements.